Reports
Dispatcher Phoenix Web provides a Report Generator Tool you can use to generate a variety of reports about your Dispatcher Phoenix system and its usage. Current reporting options are:
To access the Report Generator Tool, do the following:
- Log into Dispatcher Phoenix Web.
- Select the REPORTS button, or the Reports option from the slide out menu.
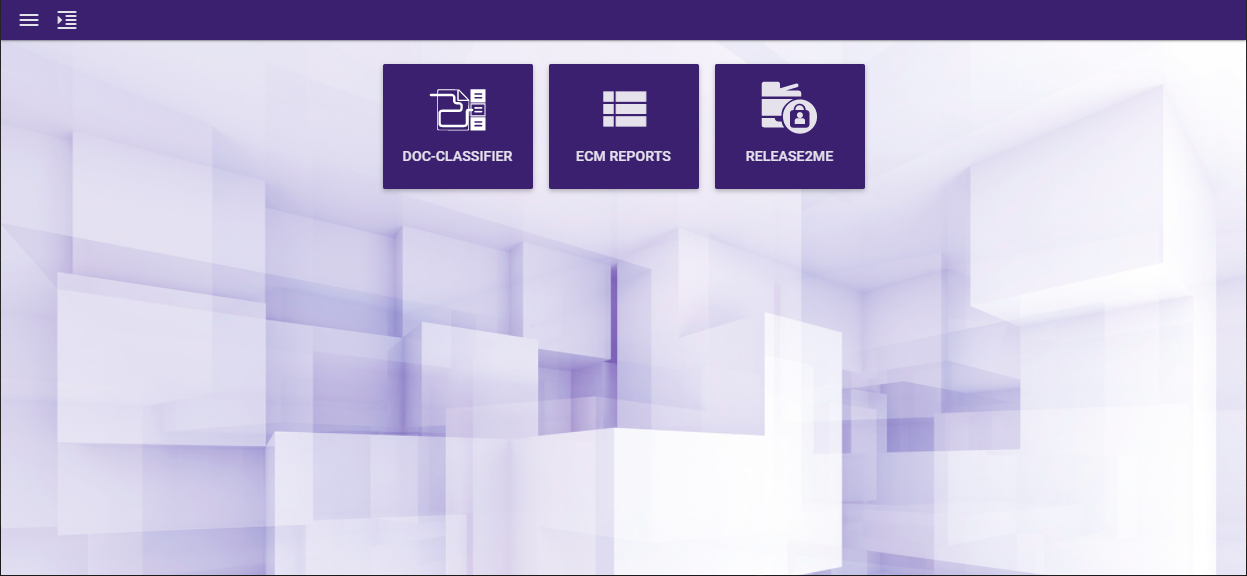
See the following illustration for an example of the Report Generator page:
Doc-Classifier Reports
To generate reports on data captured by the Doc-Classifier node, select the Doc-Classifier tile on the Report Generator page. Note that this tile appears only if the Doc-Classifier license is active on your system.
The following report types can be dynamically created:
Note: To enable data collection for the Doc-Classifier node, you must first check the Enable workflow auditing box on the Database Setup tab of the Options window in the Dispatcher Phoenix client application. To access the Options window, select Tools > Options.
You can use the controls on the Configuration panel on the left side of the page to customize each report. If you retain the default configuration settings, all available data appears in the report. You have the following configuration options:
- Start Date - The report generates data from the date range you specify here and at the End Date field. The default start date is 30 days prior to the current date. To change the date range, specify a different date here and/or at the End Date field.
- End Date - The report generates data from the date range you specify here and at the Start Date field. The default end date is the current date. To change the date range, specify a different date here and/or at the Start Date field.
- Filter Options - To restrict the report output to specified criteria, use one or more of the following filters. Each filter supports the " * " and " ? " wildcards. In addition, for each filter option, an Exclude option is available where you can exclude the specified criterion from the report. If you leave the Exclude box blank, the report includes any specified criterion.
- Classification Type - To restrict the report to a specific classification type, specify the type here, for example Invoices or W-2 Forms.
- Document Source - To restrict the report to a specific document source (that is, the node in the workflow from which the documents to classify originated), specify the source here, for example Input Folder or MFP.
- Workflow - To restrict the report to a specific Doc-Classifier workflow, specify the workflow here.
GENERATE REPORT - When finished configuring the report, click this button to generate the report and display a snapshot on the screen. The timestamp updates on right side of the Status bar. This snapshot remains until you either click this button again or exit the Doc-Classifier Report Generator page. That is, to display the results of your current report configuration, you must click this button.
Tool Bar
Once you generate a report, the Tool bar at the top of the page activates. You can use the Tool bar to search through the report and save the report in a variety of formats. In the following illustration, the Tool bar appears at the top:

-
Search - To filter the records displayed on the screen by a specified string, enter the string then click the Arrow button. The string you enter must exactly match the contents of at least one cell in the table. Otherwise, no results appear. To release the current filter, empty the Search field then click the Arrow button.
-
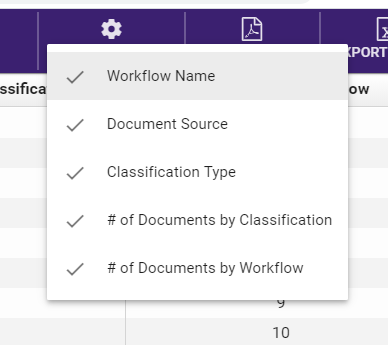
Export Options - To filter the columns in the report, click this button to display a list of columns in the selected report. Checked columns appear in the snapshot on the screen as well as in the exported report. To exclude a column, remove the check. The following illustration shows the options for the Classification Summary report:
-
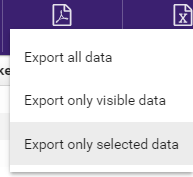
EXPORT AS PDF - Use this option to save the report in PDF format. The following options are available:
-
Export all data - Export all data to PDF format, including data filtered out of the page view.
-
Export only visible data - Export only data that is visible on the page to PDF format, limited by the Filter Options and any search criteria.
-
Export only selected data - Export only data that has been selected on the page to PDF format.
See the following illustration:
-
-
EXPORT AS CSV - Use this option to save the report in CSV format. The following options are available:
- Export all data - Export all data to CSV format, including data filtered out of the page view.
- Export only visible data - Export only data that is visible on the page to CSV format, limited by the Filter Options and any search criteria.
- Export only selected data - Export only data that has been selected on the page to CSV format.
Status Bar
Once you generate a report, the status bar appears at the bottom of the Report Generator Tool, displaying the following information:
- The type of report generated.
- The number of records generated.
- The report’s time period.
- The timestamp for the report.
See the following illustration for an example:

Executive Summary Report
The Executive Summary report displays a visual report consisting of color graphs as well as bar, column, and doughnut charts, as shown in the following illustration:
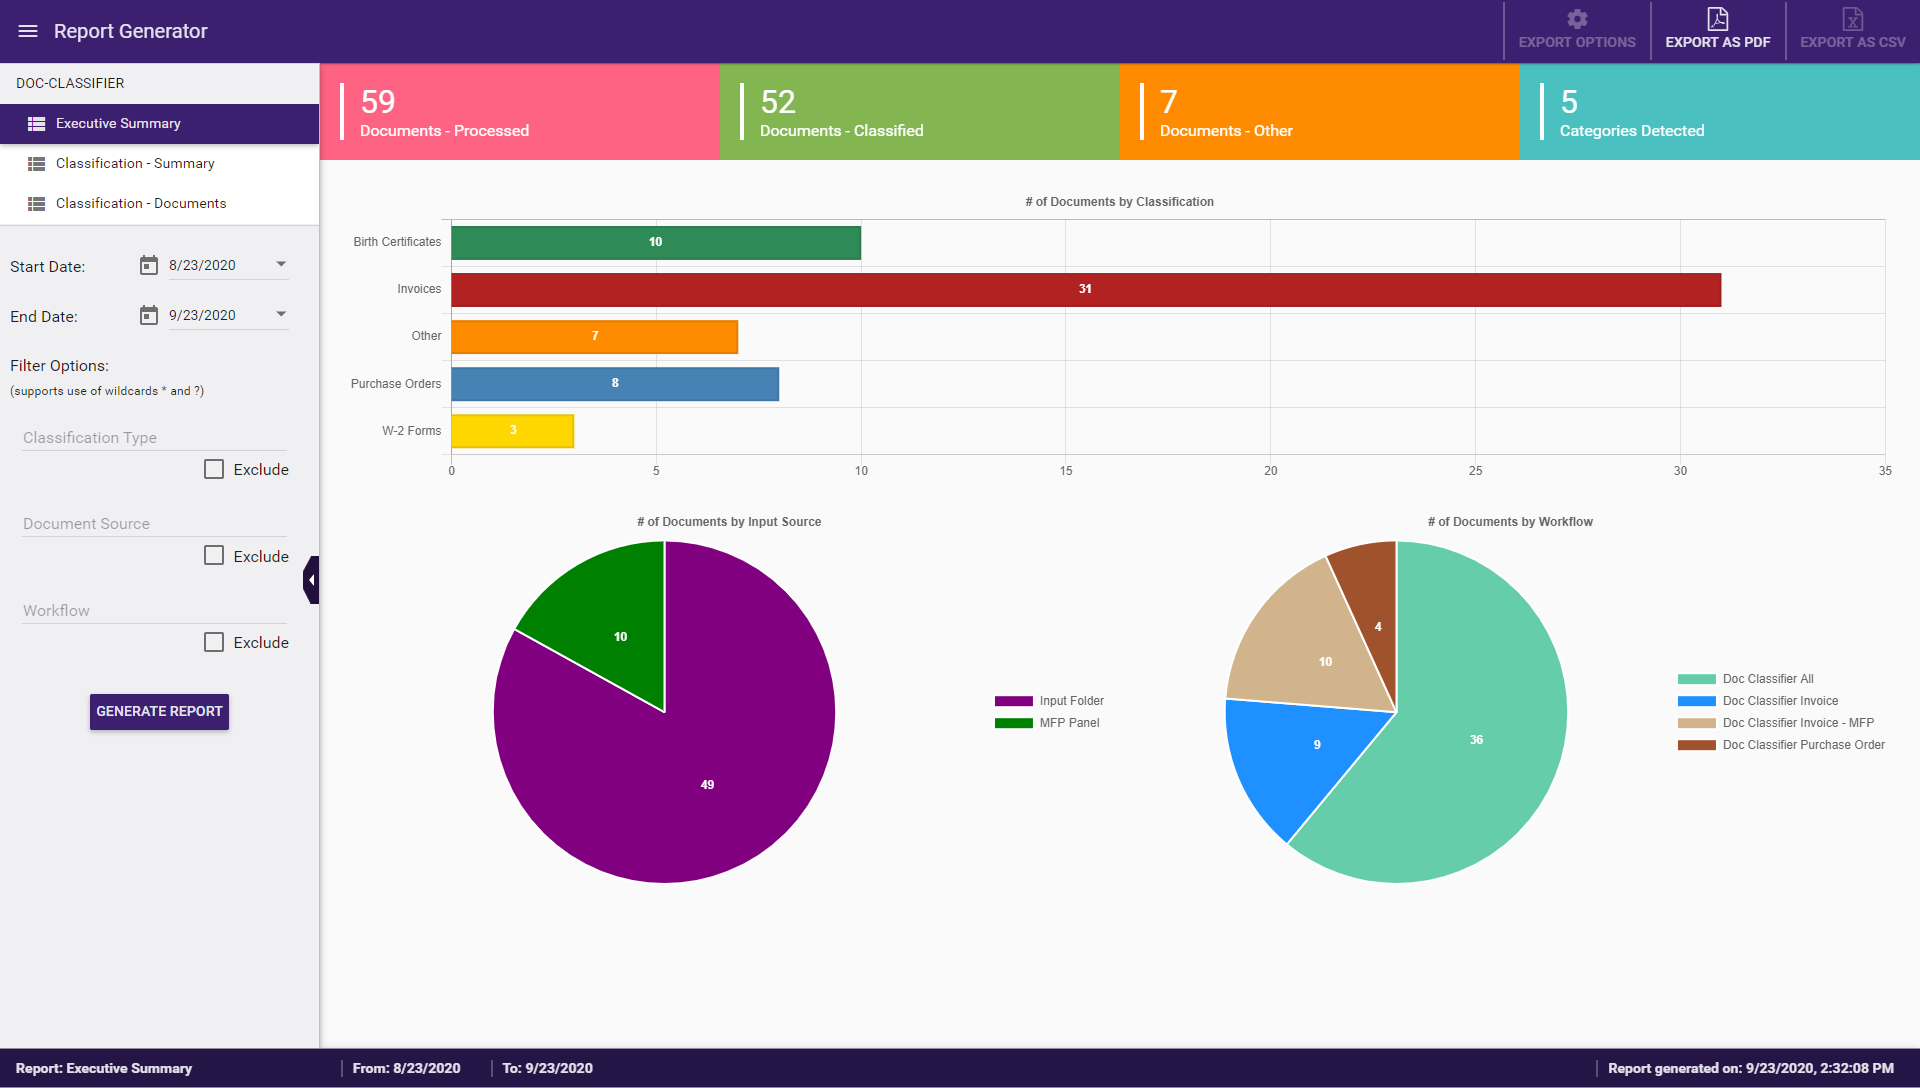
The report provides a comprehensive visual summary of Doc-Classifier activity, including the following information from Doc-Classifier workflows:
- Total documents processed
- Total documents classified
- Total documents not classified - Other
- Total categories detected
- Total number of documents by:
- Classification
- Input source
- workflow
On visual reports, you can do the following:
- For bar graphs, you can hover over a bar to display information on the data item.
- For pie charts, you can do the following:
- Hover over a pie section to display information on the data item.
- Click on one or more legend items to exclude those sections from the pie. For example, if the pie legend lists four document types, if you click on one, that section disappears from the pie and only three sections remain. To restore the pie section, click on the legend item again.
Export as PDF
To export the visual report as a PDF file, click the EXPORT AS PDF button on the right of the Tool bar. Note that the other Export buttons on the page are not active for visual reports such as the Executive Summary report.
Classification - Summary Report
Use this report to display a summary of classification activity performed by the Doc-Classifier node. The report includes the following information:
- Workflow name
- Document source
- Classification type
- Number of documents by classification
- Number of documents by workflow
See the following illustration for an example:
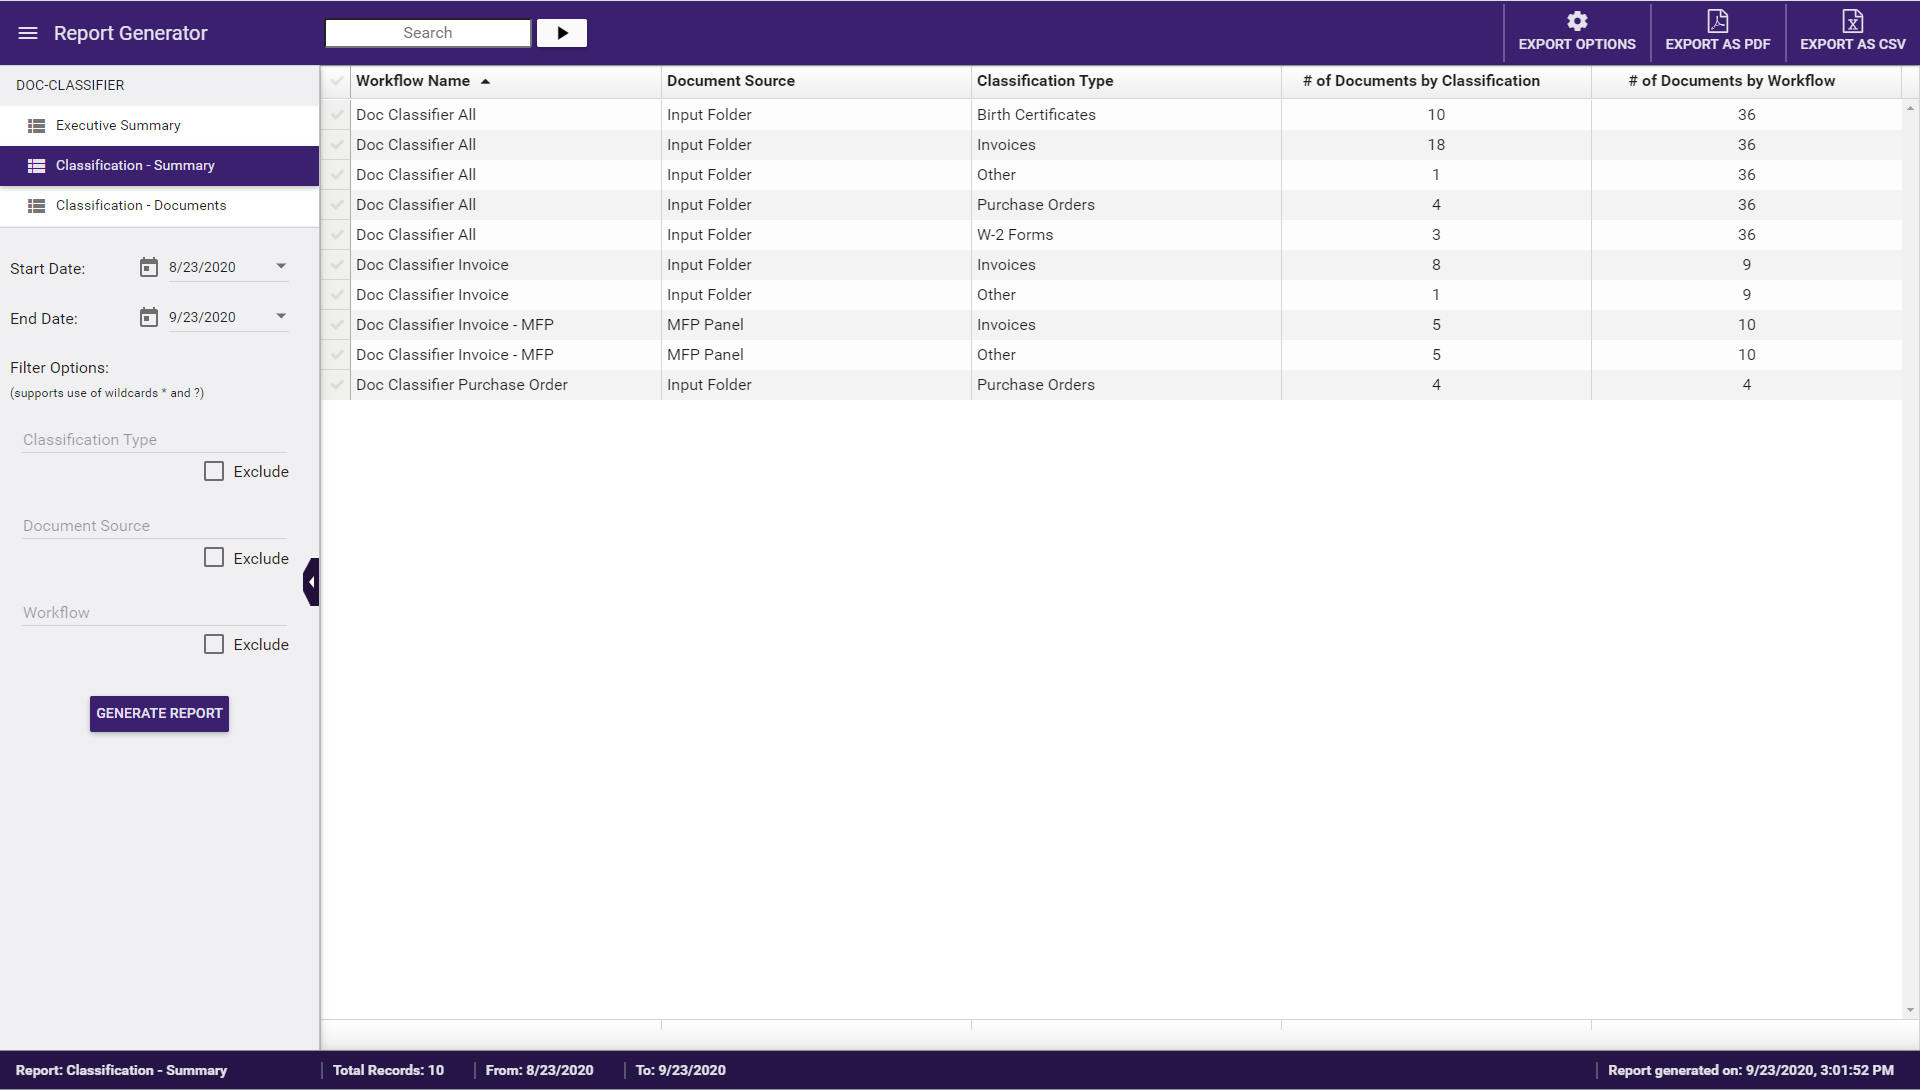
On the report, you can do the following:
- Select a specific record by checking the box in the row that you are interested in, for example to select one or more records for export.
- Select all records by checking the box located in Column 1, Row 1, for example to select all records for export.
- Sort data in ascending or descending order by clicking on the column’s up/down arrow.
Classification - Documents Report
This report lists all documents classified by the Doc-Classifier node, including documents classified as “other”. For each document in the report, the following information appears:
- Workflow name
- Document name
- Document source
- Classification type
See the following illustration for an example:
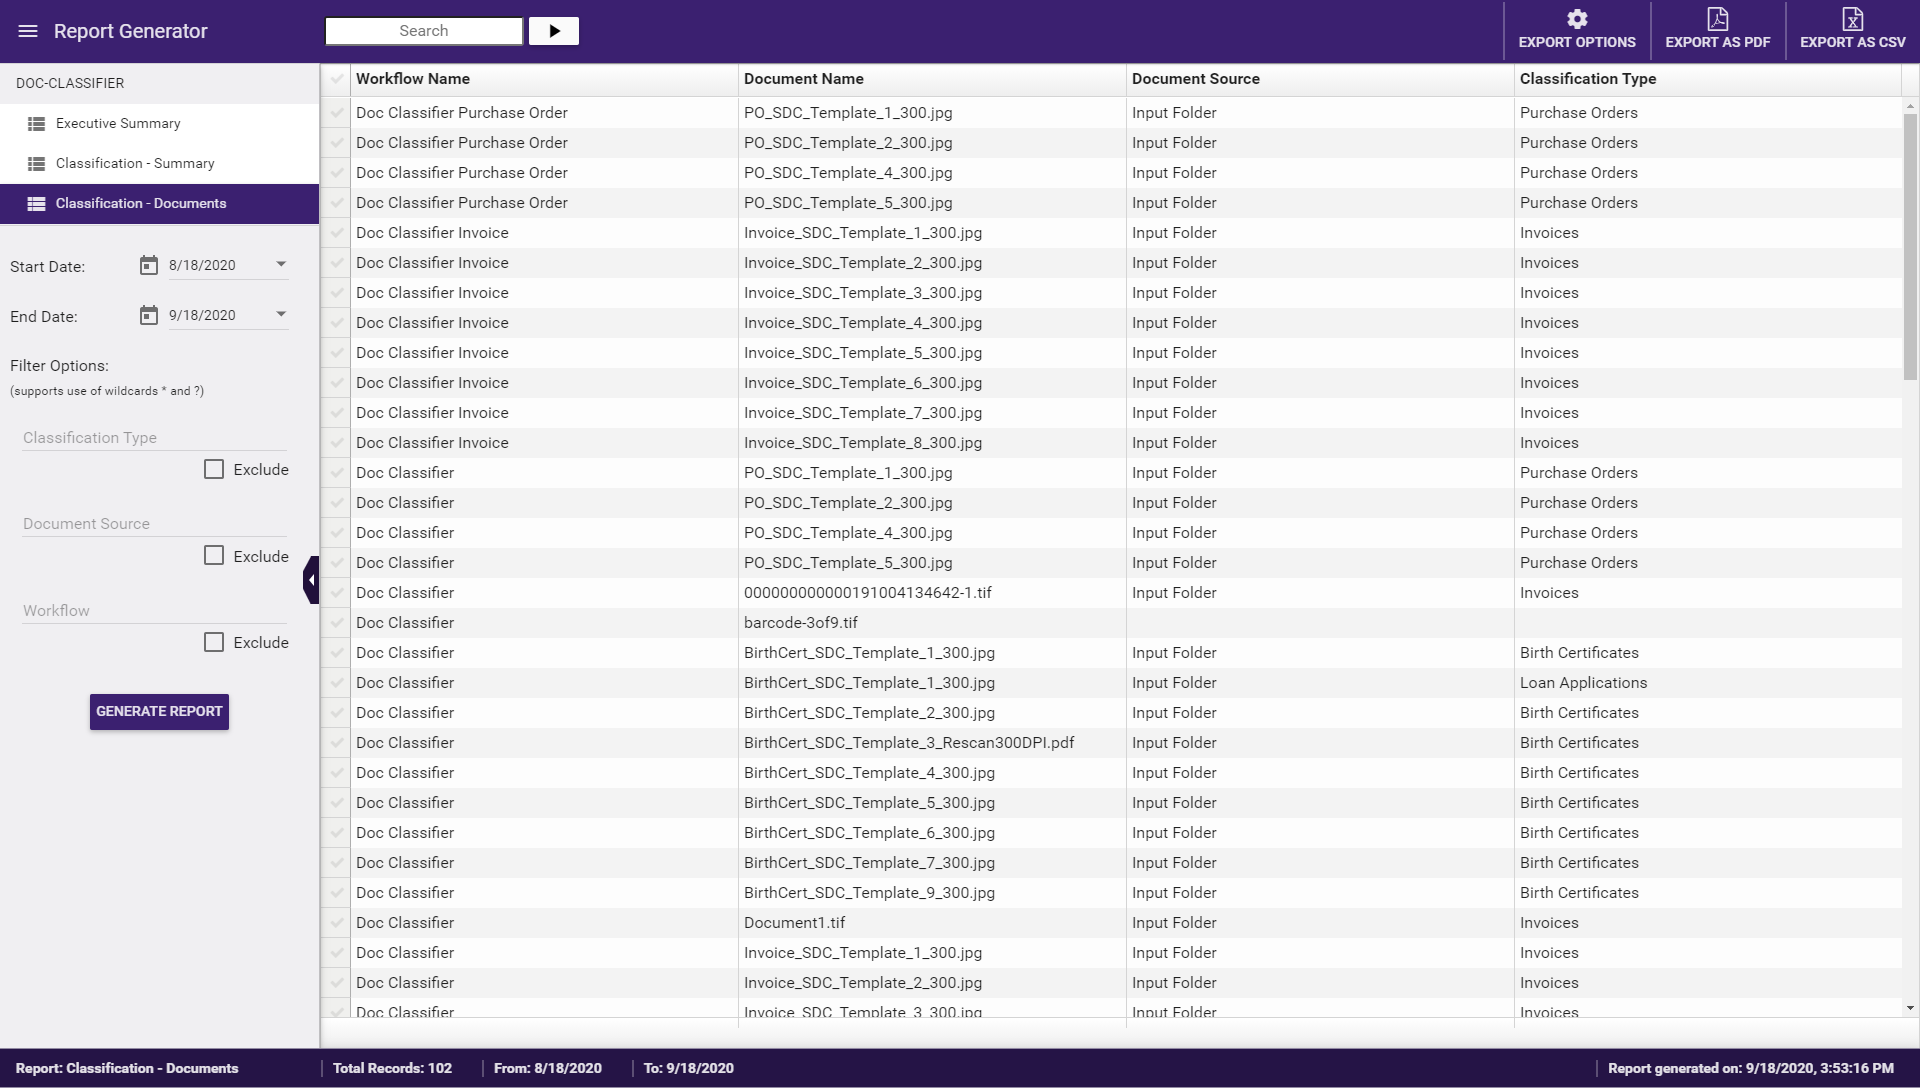
On the report, you can do the following:
- Select a specific record by checking the box in the row that you are interested in, for example to select one or more records for export.
- Select all records by checking the box located in Column 1, Row 1, for example to select all records for export.
- Sort data in ascending or descending order by clicking on the column’s up/down arrow.
ECM Reports
Dispatcher Phoenix Web provides a Report Generator Tool that allows users to generate a variety of reports about their Batch Indexing and Verification operations. The option for ECM Reports appears only if an ECM add-in such as Batch Indexing or Verification is enabled. Current ECM reports include:
- Keystroke Tracking Report - Tracks the number of keystrokes that were pressed during the indexing of a specific batch.
- Batch Summary Report - Lists statistical information about each batch that has been submitted, including information about the average processing time per document and batch.
- User Productivity Report - Lists statistical information about each DP Web user using the ECM tool set, including information about number of keystrokes entered, total processing time, and much more.
To generate a report, do the following:
-
Click on the specific report that you are interested in. Other options will then appear, as in the following illustration:
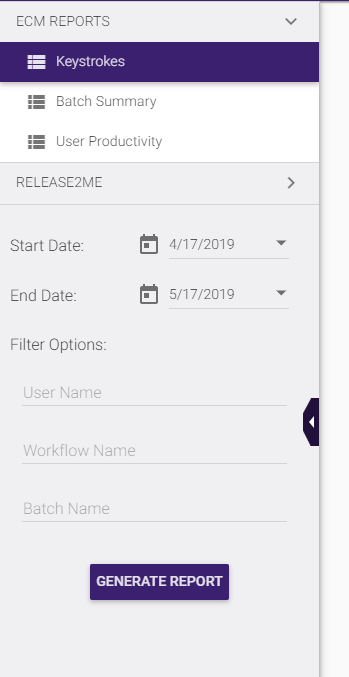
-
Use the Start Date and End Date drop-down lists to specify a time period for the report.
-
If necessary, enter a user name, workflow name, or batch name in the supplied fields to filter the report accordingly.
-
Select the GENERATE REPORT button when you are done.
The generated report then appears in the main section of the window, as in the following illustration:
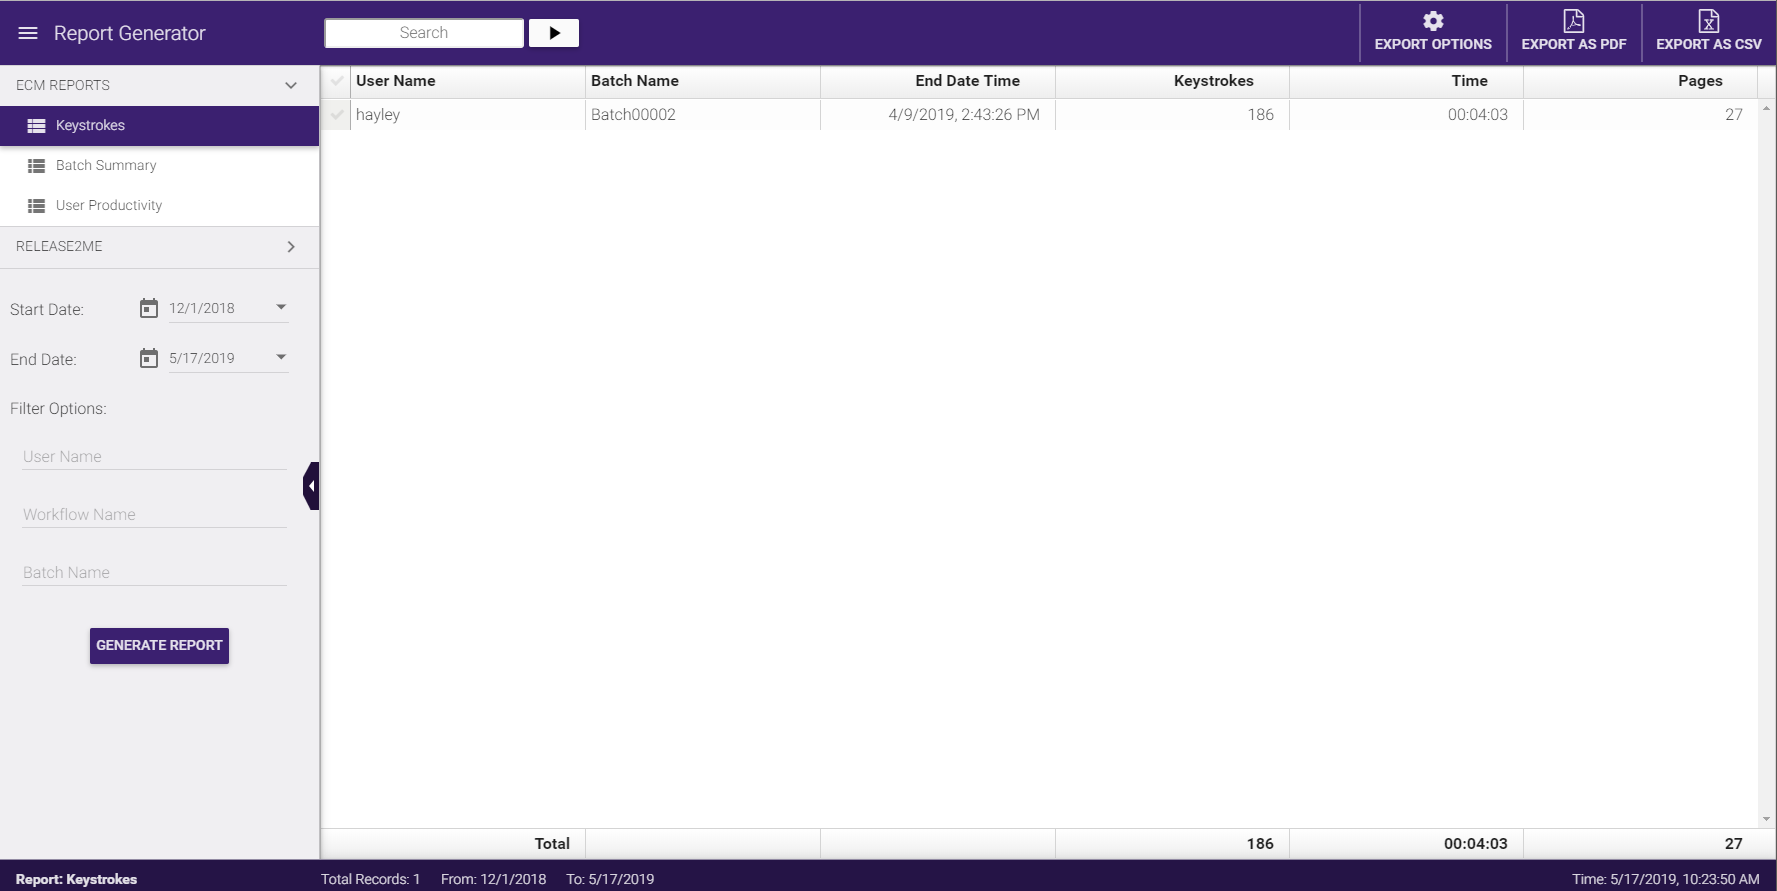
Now the tool bar at the top of the page activates and a status bar at the bottom of the page appears.
On the report, you can do the following:
- Select a specific record by clicking on the checkmark box in the row that you are interested in.
- Select all records by clicking on the checkmark box located in Column 1, Row 1.
- Sort data in ascending or descending order by clicking on the column’s up/down arrow.
Key Features
-
Tool Bar - The Report Generator Tool includes a tool bar you can use to search through the report and save the report in a variety of formats. See the following illustration for an example:

-
Search - Allows you to enter text to filter the records displayed in the report. Click on the arrow button next to the field to begin the search process.
-
Export Options - Filter the specific data that you want included in the report. If you de-select an option, that data will no longer appear in the report. The options available from the drop-down list will vary, depending on the report that you have generated. For example, with the Keystroke Tracking Report, you can choose the following:

-
EXPORT AS PDF - Save the report in PDF format. The following options are available:
-
Export all data - Export all data to PDF format.
-
Export only visible data - Export only data that is visible on the page to PDF format, limited by the Filter Options and any search criteria.
-
Export only selected data - Export only data that has been selected on the page to PDF format.
See the following illustration:

-
-
EXPORT AS CSV - Save the report in CSV format. The following options are available:
- Export all data - Export all data to CSV format.
- Export only visible data - Export only data that is visible on the page to CSV format, limited by the Filter Options and any search criteria.
- Export only selected data - Export only data that has been selected on the page to CSV format.
-
-
Status Bar - The status bar at the bottom of the Report Generator Tool displays the following information:
-
The type of report generated.
-
The number of records generated.
-
The report’s time period.
-
The date/time that the report was generated.
See the following illustration for an example:

-
Keystroke Summary Report
The Keystroke Summary Report records the following information:
-
User Name - The name of the DP Web logged-in user.
-
Batch Name - The name of the batch that was indexed.
-
End Date Time - The date/time that the batch was submitted.
-
Keystrokes - The number of keystrokes that were entered for that batch.
-
Time - The amount of time it took to index that batch.
-
Pages - The number of pages that were indexed.
At the bottom of the report, the following information is recorded:
- Total number of keystrokes.
- Total number of time spent.
- Total number of pages.
See the following illustration for an example:

Batch Summary Report
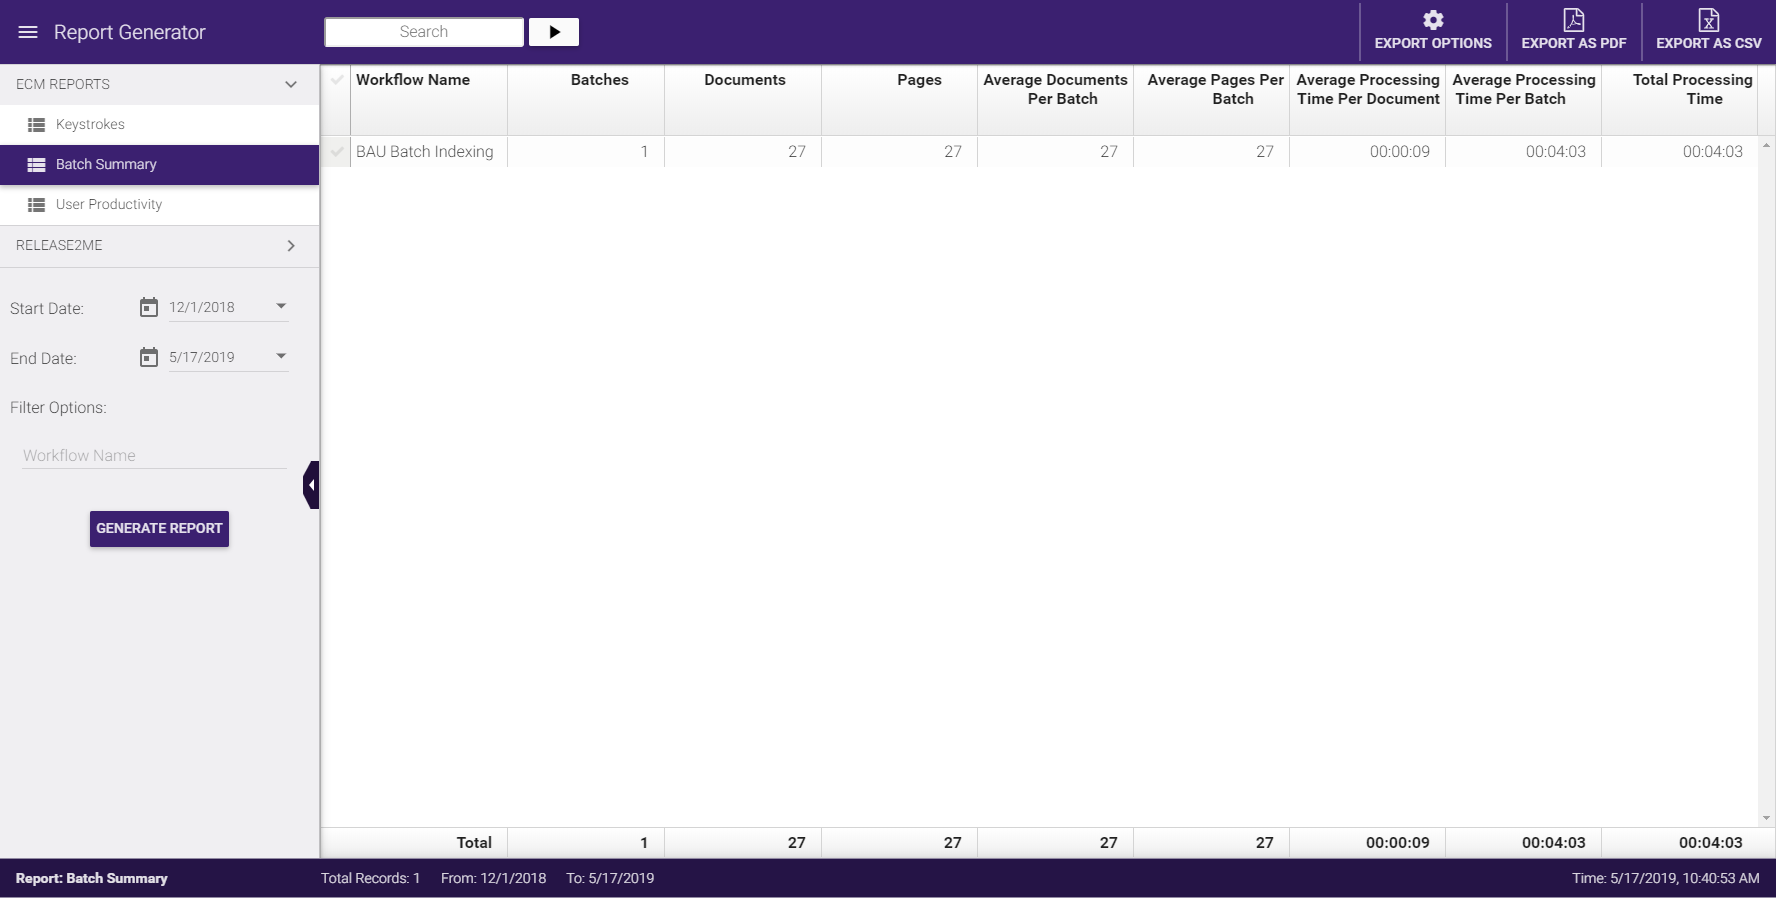
The Batch Summary Report records summary information about the batches that were processed, including the following information:
-
Workflow Name - The name of the workflow that was used to process a batch.
-
Batches - The number of batches that were processed by the workflow. Please note that this number increments only when a new batch is submitted to the workflow.
-
Documents - The total number of documents that were processed by the workflow.
-
Pages - The total number of pages that were processed by the workflow.
-
Average Documents Per Batch - The average number of documents within each batch.
-
Average Pages Per Batch - The average number of pages within each batch.
-
Average Processing Time Per Document - The average time that it took the operator to process (index/verify) each document.
-
Average Processing Time Per Batch - The average time that it took the operator to process (index/verify) each batch.
-
Total Processing Time - The total amount of time that it took the operator to process (index or verify) all documents.
At the bottom of the report, the following information is displayed:
- Total number of batches included in the report.
- Total number of documents included in the report.
- Total number of pages included in the report.
- Average number of documents in all batches.
- Average number of pages in all batches.
- Average processing time for all documents.
- Average processing time for all batches.
- Total processing time for all batches.
See the following illustration for an example:
User Productivity Report
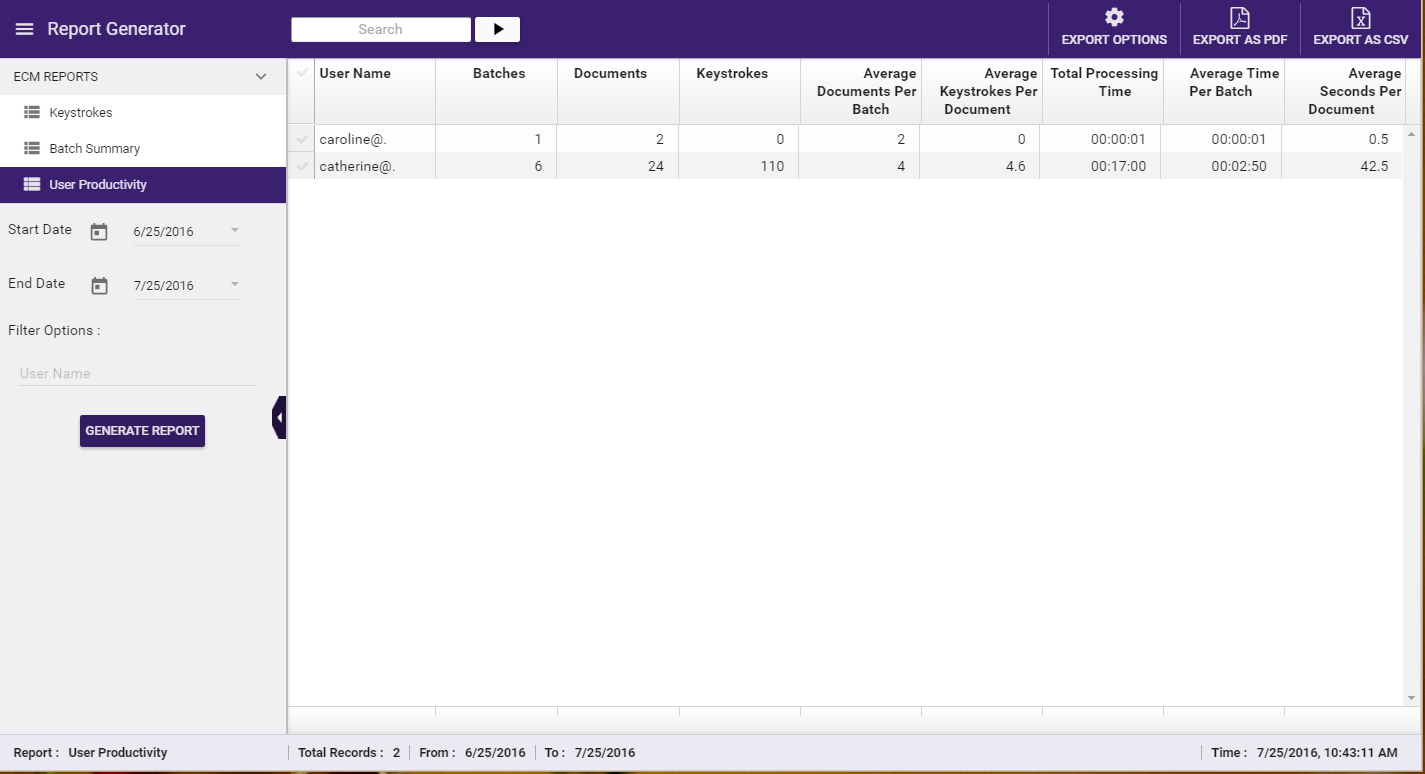
The User Productivity Report records/displays summary information about each operator that has used Batch Indexing and/or Verification tools in DP Web, including the following:
-
User Name - The name of the logged-in user that processed a batch.
-
Batches - The number of batches that were processed by the user.
-
Documents - The total number of documents that were processed by the user.
-
Keystrokes - The total number of keystrokes that were entered by the user.
-
Average Documents Per Batch - The average number of documents that were processed by the user.
-
Average Keystrokes Per Document - The average number of keystrokes that were entered by the user.
-
Total Processing Time - The total amount of time that it took the user to process (index or verify) all documents.
-
Average Time Per Batch - The average time it took the user to process a batch.
-
Average Seconds Per Document - The average number of seconds it took the user to process each document.
See the following illustration for an example:
Release2Me Reports
To generate reports on the printing activity of your business or organization, select the Release2Me tile on the Report Generator page. The option for Release2Me Reports will only be enabled when Release2Me Device Licenses are activated. The following types of reports can be dynamically created:
You can use the controls on the left hand side of the page to customize each report. Do the following:
- Specify a time frame for the report using the Start Date and End Date controls.
- Choose one or more of the following filters:
- Users - To run a report on printing activity of a specific user or group of users, enter the full name of the user(s) in the Users field. Multiple names must be separated by a comma. To exclude the specified user(s) from the report, check the Exclude box below the Users field.
- Devices - To run a report on the usage of a specific device or group of devices, enter the device name in the Devices field. Multiple device names must be separated by a comma. To exclude the specified device(s) from the report, check the Exclude box below the Devices field.
- Documents - To run a report on a specific document or group of documents, enter the full document name (including file type) in the Documents field. Multiple document names must be separated by a comma. To exclude the specified document(s) from the report, check the Exclude box below the Documents field.
- Choose the type of report that you want to generate from the Display Type drop-down list. You can choose to display the data in a visual format with colorful graphs, bar, column, and doughnut charts, etc., or in a tabular format.
- Select the GENERATE REPORT button.
Visual Report
When selecting the Visual Report display type, your organization’s data will be displayed using color graphs, bar, column and doughnut charts, etc. as shown in the following illustration:
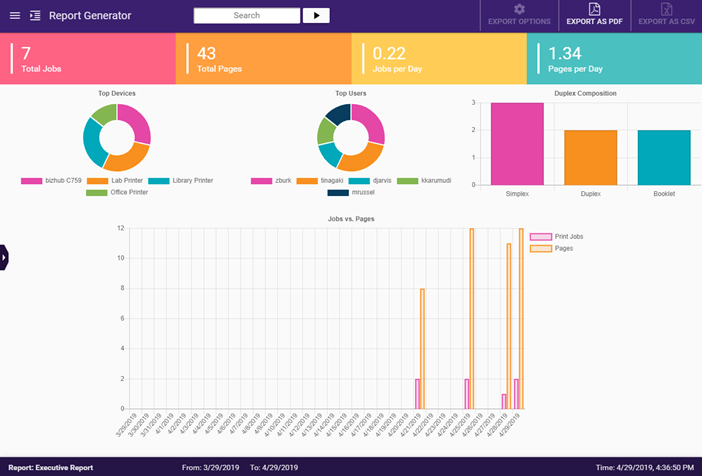
Visual Reports provide a summary of the total job and pages along with daily averages. In addition, using Visual Reports you can view your organizations top devices and users as well as the composition of print jobs using Release2Me including whether or not the job was printed simplex, duplex or as a booklet.
Using the EXPORT AS PDF button in the upper right corner, you can choose to export your Visual Report as a PDF file.
Table Report
When selecting the Table Report display type, your organization’s Release2Me data will be displayed in a tabular format as shown in the following illustration:
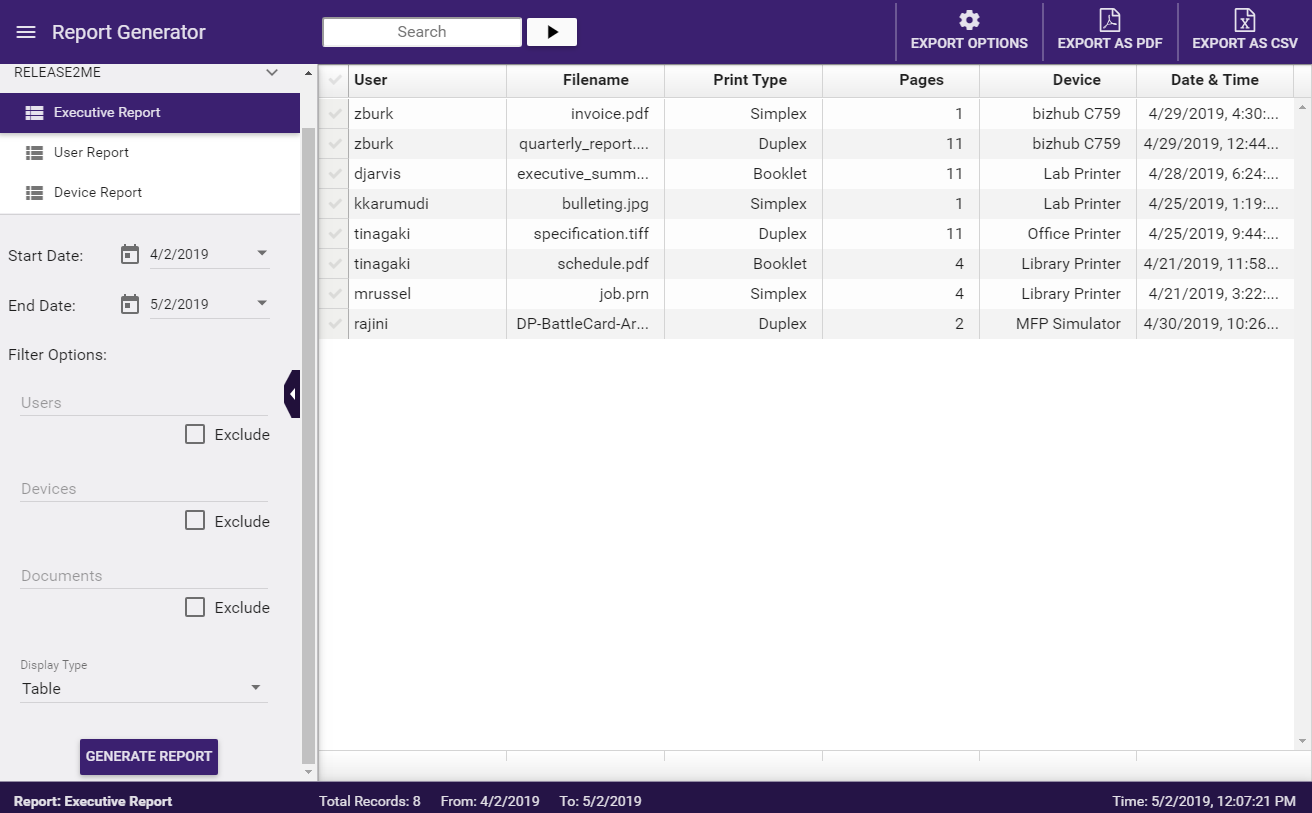
A Table Report records/displays summary information about each print job that has been released using the Release2Me node.
To customize the data in the Table Report, select the EXPORT OPTIONS button in the upper right hand corner. When the dropdown opens, you may enable or disable a column header. Then, use the EXPORT AS PDF button or the EXPORT AS CSV button to export your Table Report.
Executive Report
The Executive Report provides users with a thorough analysis of overall printing activity, including the following information:
- Total number of print jobs submitted.
- Total number of pages printed.
- Average number of print jobs submitted per day.
- Average number of pages printed per day.
- The top devices used.
- The top users printing.
- A comparison of simplex, duplex, and booklet printing.
To build this report, select the Executive Report option from the left hand menu.
See the following illustration for an example:

User Report
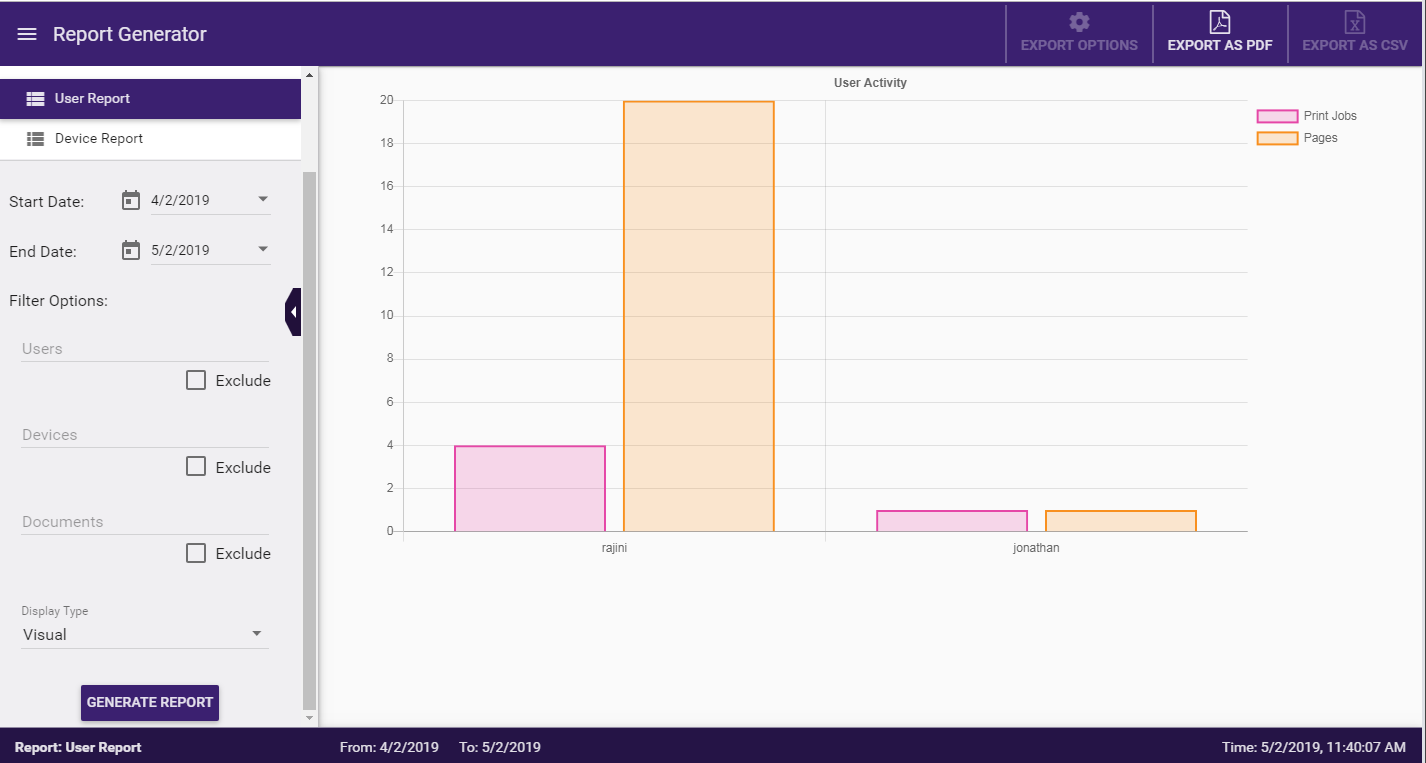
The User Report provides information on user activity, allowing you to compare specific users or track the activity of a specific user. The User Report includes the following data:
- The name of the logged-in user that released the print job.
- The total number of print jobs.
- The total number of pages.
- The % of total jobs.
- The % of total pages.
To build this report, select the User Report option from the left hand menu.
See the following illustration for an example:
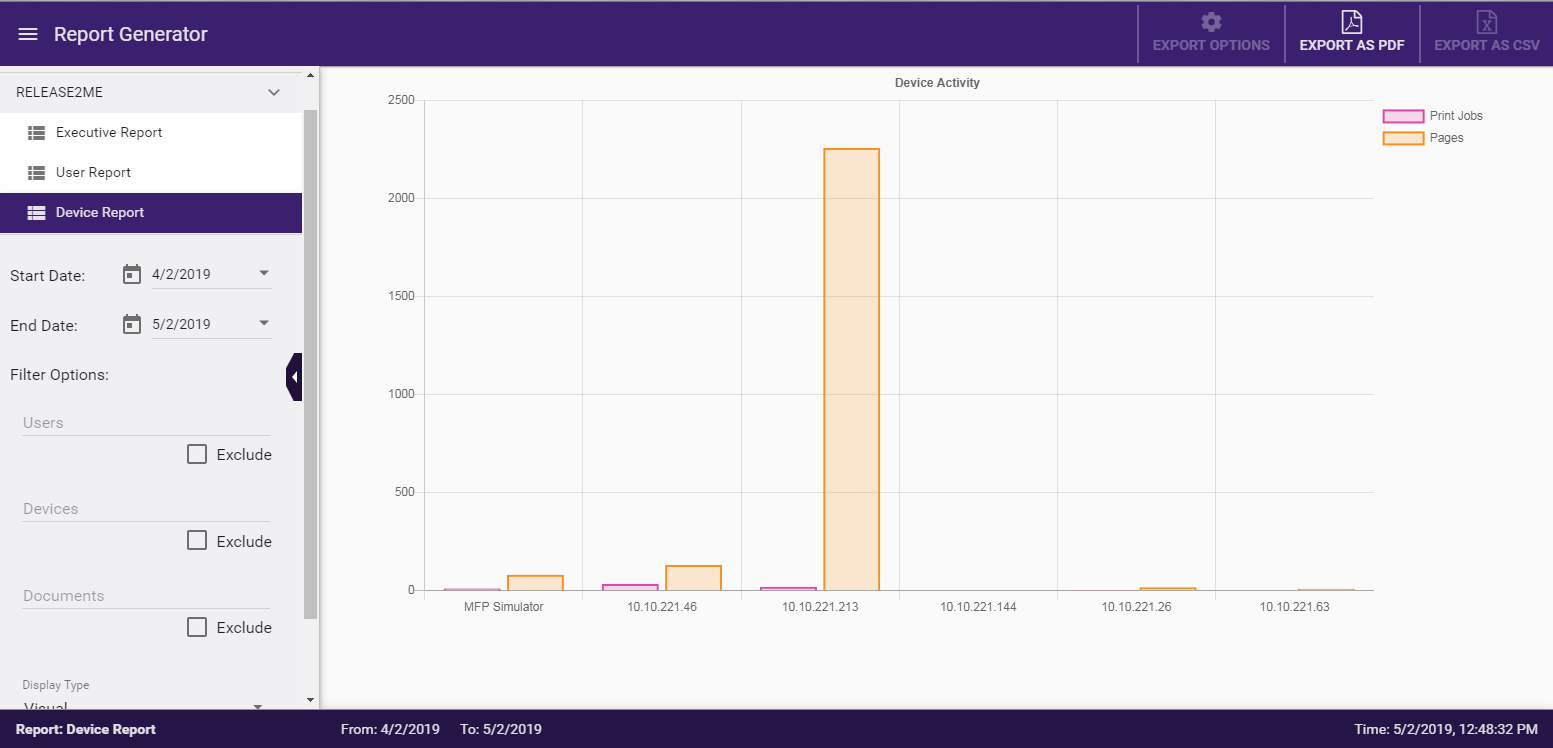
Device Report
The Device Report provides information on device usage, allowing you to compare print activities by device or analyze a particular printer. The Device Report includes the following data:
- The name of the logged-in user that released the print job.
- The total number of print jobs.
- The total number of pages.
- The % of total jobs.
- The % of total pages.
To build this report, select the Device Report option from the left hand menu.
See the following illustration for an example:
