Executive Summary
The purpose of this document is to provide guidelines on monitoring the overall performance and system health of Dispatcher Paragon in the production environment.
This document is intended as a guide only; it is intended to supplement, not replace, the expertise of the contracted infrastructure monitoring team.
Best Practices
From a high level perspective, monitoring the performance and health of the solution can be answered in five questions:
- Are the services running as needed?
- What is the CPU utilization?
- What is the memory utilization?
- What is the hard disk utilization?
- What is the network utilization?
Most common issues resulting in a degradation or outright denial of service will manifest by one of these metrics falling outside of the normal boundaries. Such variances will indicate a need to begin diagnosis for system performance issues.
Konica Minolta recommends looking at the general health of services using a multitude of tools. Aside from monitoring the general health of the underlying infrastructure - which is beyond the scope of this article - there are operating system and service-level metrics that can be leveraged. These include standard tools, such as the use of Performance Monitor and Windows Service Monitoring, but also the use of Dispatcher Paragon-specific APIs and tools.
Windows Performance Counters
Microsoft Windows operating systems come with the standard monitoring tool perfmon.exe. This solution is more robust than Task Manager or Resource Monitor, in that it provides a wider array of metrics and logging support. The following metrics should be noted when analyzing Dispatcher Paragon servers for stability. Technicians familiar with perfmon can set up monitoring to alert when deviations appear.
Values marked with a (*) indicate that each individual instance will be collected.
Values marked with a (_Total) indicate that the sum or average (where appropriate) of all instances will be collected.
Value Collected | Description (from Perfmon) | Ideal Range | Notes |
|---|---|---|---|
\Memory\Available Mbytes | Available MBytes is the amount of physical memory, in Megabytes, immediately available for allocation to a process or for system use. It is equal to the sum of memory assigned to the standby (cached), free and zero page lists. | N/A |
|
\Memory\Pages/sec | Pages/sec is the rate at which pages are read from or written to disk to resolve hard page faults. This counter is a primary indicator of the kinds of faults that cause system-wide delays. It is the sum of Memory\\Pages Input/sec and Memory\\Pages Output/sec. It is counted in numbers of pages, so it can be compared to other counts of pages, such as Memory\\Page Faults/sec, without conversion. It includes pages retrieved to satisfy faults in the file system cache (usually requested by applications) non-cached mapped memory files. | Near 0. | This is an indicator of how often page files are written or read from disk. High values indicate low memory management. |
\Memory\Pages Input/sec | Pages Input/sec is the rate at which pages are read from disk to resolve hard page faults. Hard page faults occur when a process refers to a page in virtual memory that is not in its working set or elsewhere in physical memory, and must be retrieved from disk. When a page is faulted, the system tries to read multiple contiguous pages into memory to maximize the benefit of the read operation. Compare the value of Memory\\Pages Input/sec to the value of Memory\\Page Reads/sec to determine the average number of pages read into memory during each read operation. | Near 0. | Occasional spikes are expected. |
\Memory\Pool Nonpaged Bytes | Pool Nonpaged Bytes is the size, in bytes, of the nonpaged pool, an area of the system virtual memory that is used for objects that cannot be written to disk, but must remain in physical memory as long as they are allocated. Memory\\Pool Nonpaged Bytes is calculated differently than Process\\Pool Nonpaged Bytes, so it might not equal Process(_Total)\\Pool Nonpaged Bytes. This counter displays the last observed value only; it is not an average. | N/A |
|
\Memory\Pool Paged Bytes | Pool Paged Bytes is the size, in bytes, of the paged pool, an area of the system virtual memory that is used for objects that can be written to disk when they are not being used. Memory\\Pool Paged Bytes is calculated differently than Process\\Pool Paged Bytes, so it might not equal Process(_Total)\\Pool Paged Bytes. This counter displays the last observed value only; it is not an average. | N/A |
|
\Memory\% Committed Bytes in Use | % Committed Bytes In Use is the ratio of Memory\\Committed Bytes to the Memory\\Commit Limit. Committed memory is the physical memory in use for which space has been reserved in the paging file should it need to be written to disk. The commit limit is determined by the size of the paging file. If the paging file is enlarged, the commit limit increases, and the ratio is reduced). This counter displays the current percentage value only; it is not an average. | Less than 50%. |
|
\Network Interface(*)\Packets Received Errors | Packets Received Errors is the number of inbound packets that contained errors preventing them from being deliverable to a higher-layer protocol. | Near 0. |
|
\Network Interface(*)\Output Queue Length | Output Queue Length is the length of the output packet queue (in packets). If this is longer than two, there are delays and the bottleneck should be found and eliminated, if possible. Since the requests are queued by the Network Driver Interface Specification (NDIS) in this implementation, this will always be 0. | Less than 2. | Higher than an average of 2 indicates a network bottleneck. |
\Network Interface(*)\Bytes Total/sec | Bytes Total/sec is the rate at which bytes are sent and received over each network adapter, including framing characters. Network Interface\Bytes Total/sec is a sum of Network Interface\Bytes Received/sec and Network Interface\Bytes Sent/sec. | N/A |
|
\PhysicalDisk(_Total)\Avg. Disk sec/Read | Avg. Disk sec/Read is the average time, in seconds, of a read of data from the disk. | Near 0. | Useful metric for determining disk latency. Higher values are bad. |
\PhysicalDisk(_Total)\Avg. Disc sec/Transfer | Avg. Disk sec/Transfer is the time, in seconds, of the average disk transfer. | Near 0. | Useful metric for determining disk latency. Higher values are bad. |
\PhysicalDisk(_Total)\Avg. Disk sec/Write | Avg. Disk sec/Write is the average time, in seconds, of a write of data to the disk. | Near 0. | Useful metric for determining disk latency. Higher values are bad. |
\PhysicalDisk(*)\Current Disk Queue Length | Current Disk Queue Length is the number of requests outstanding on the disk at the time the performance data is collected. It also includes requests in service at the time of the collection. This is a instantaneous snapshot, not an average over the time interval. Multi-spindle disk devices can have multiple requests that are active at one time, but other concurrent requests are awaiting service. This counter might reflect a transitory high or low queue length, but if there is a sustained load on the disk drive, it is likely that this will be consistently high. Requests experience delays proportional to the length of this queue minus the number of spindles on the disks. For good performance, this difference should average less than two. | 2-3 per spindle during idle. | During spikes, check correlation to \Memory\Pages Input/sec |
\PhysicalDisk(_Total)\Disk Bytes/sec | Disk Bytes/sec is the rate bytes are transferred to or from the disk during write or read operations. | N/A | Check Correlation between this and \PhysicalDisk\Current Disk Queue Length and \Memory\Pages Input/sec. |
\PhysicalDisk(_Total)\% Idle Time | % Idle Time reports the percentage of time during the sample interval that the disk was idle. | Varies | Very low idle time indicates either the system is being overutilized or the disk isn't responsive enough. Compare to physical disk metrics. A very high idle time indicates the server is being underutilized. |
\Process(_Total)\Working Set | Working Set is the current size, in bytes, of the Working Set of this process. The Working Set is the set of memory pages touched recently by the threads in the process. If free memory in the computer is above a threshold, pages are left in the Working Set of a process even if they are not in use. When free memory falls below a threshold, pages are trimmed from Working Sets. If they are needed they will then be soft-faulted back into the Working Set before leaving main memory. | N/A | Useful for comparison to the \Memory metrics. |
\Processor(_Total)\%Processor Time | % Processor Time is the percentage of elapsed time that the processor spends to execute a non-Idle thread. It is calculated by measuring the percentage of time that the processor spends executing the idle thread and then subtracting that value from 100%. (Each processor has an idle thread that consumes cycles when no other threads are ready to run). This counter is the primary indicator of processor activity, and displays the average percentage of busy time observed during the sample interval. It should be noted that the accounting calculation of whether the processor is idle is performed at an internal sampling interval of the system clock (10ms). On todays fast processors, % Processor Time can therefore underestimate the processor utilization as the processor may be spending a lot of time servicing threads between the system clock sampling interval. Workload based timer applications are one example of applications which are more likely to be measured inaccurately as timers are signaled just after the sample is taken. | Less than 50% | With high values, compare to processor queue length to determine total load on the system. |
\Processor(_Total)\% Idle Time | % Idle Time is the percentage of time the processor is idle during the sample interval | 50% or more. | This, with \Processor(_Total)\% Processor Time, helps us understand how much time is spent context switching. |
\System\Processor Queue Length | Processor Queue Length is the number of threads in the processor queue. Unlike the disk counters, this counter counters, this counter shows ready threads only, not threads that are running. There is a single queue for processor time even on computers with multiple processors. Therefore, if a computer has multiple processors, you need to divide this value by the number of processors servicing the workload. A sustained processor queue of less than 10 threads per processor is normally acceptable, dependent of the workload. | Less than 10 per processor. |
|
\TCPv4\Connection Failures | Connection Failures is the number of times TCP connections have made a direct transition to the CLOSED state from the SYN-SENT state or the SYN-RCVD state, plus the number of times TCP connections have made a direct transition to the LISTEN state from the SYN-RCVD state. | N/A | This is an aggregator since the last system restart. Examine the delta between samples. A high change could be an indicator of network issues. |
\TCPv4\Connections Established | Connections Established is the number of TCP connections for which the current state is either ESTABLISHED or CLOSE-WAIT. | Varies | This tells us how many active connections are present. |
\TCPv4\Connections Reset | Connections Reset is the number of times TCP connections have made a direct transition to the CLOSED state from either the ESTABLISHED state or the CLOSE-WAIT state. | N/A | This is an aggregator since the last system restart. Examine the delta between samples. A high change could be an indicator of network issues. |
\TCPv6\Connection Failures | Connection Failures is the number of times TCP connections have made a direct transition to the CLOSED state from the SYN-SENT state or the SYN-RCVD state, plus the number of times TCP connections have made a direct transition to the LISTEN state from the SYN-RCVD state. | N/A | Reserved for future use |
\TCPv6\Connections Established | Connections Established is the number of TCP connections for which the current state is either ESTABLISHED or CLOSE-WAIT. | N/A | Reserved for future use |
\TCPv6\Connections Reset | Connections Reset is the number of times TCP connections have made a direct transition to the CLOSED state from either the ESTABLISHED state or the CLOSE-WAIT state. | N/A | Reserved for future use |
Additional Performance Monitoring Metrics: Microsoft SQL Server
Value Collected | Description |
|---|---|
Process Object : % Processor Time : sqlservr | CPU Time consumed by the SQLSERVR process (Microsoft SQL Server service process). |
SQL Server Access Methods Object : Full Scans / Sec | Full Scan Access Method is bypassing all indexes and may indicate sub-optimal performance. Certain amount of full-scan accesses cannot be prevented, but extensive usage of Full Scan accesses should trigger analysis and optimization. |
SQL server Databases : Active transactions : All instances | Number of cuncurrently running transaction. Should not exceed long-term observed threshold. While this number is closely related to user activity happening in the system, having this metric grow continuously over a long periods of time may indicate problems. |
SQL server Databases : Transactions/sec : All instances | Performance oriented metric indicating database engine throughput. |
SQL server: Transactions: Longest Transaction Running time | Transactions represent database operations, which are all time bound. Some transactions are long running, but no transactions should run indefinitely. |
SQL Server Buffer Manager Object : Cache Hit Ratio (Buffer Cache hit ratio) | Performance oriented metrics. If the cache hit ratio is steadily low, analysis of the performance profile should be triggered to optimize cache utilization. |
SQL Server General Statistics Object : User Connections | Number of concurrent user connections. While there can be up to hundreds of concurrent connections, this number should not exceed certain threshold. Please refer to SafeQ configuration to determine such threshold.
|
SQL Server Locks Object : Average Wait Time : All instances | Average wait time on SQL Server locks - for mutual exclusions on shared resources. Wait time should stay below or around certain observed threshold. If this number is steadily growing, that may indicate a problem. |
SQL Server Locks Object : Number of deadlocks /sec: All instances | Deadlocks indicate deadlocked transactions. |
Service Monitoring
Dispatcher Paragon is comprised of several services, which vary by server role and functionality. However, the general health of all of these services is important for stable and sustained operation of the solution as a whole:
Service Name | Description | Server Roles | Notes |
|---|---|---|---|
Dispatcher Paragon Terminal Server | Responsible for communication and AAA (Authentication, Authorization, Accounting) | Site Server | |
Dispatcher Paragon Spooler Controller Group Service | Responsible for synchronization of Site Servers within a group | Site Server | Startup type is manual by default, service is running when cluster is formed. It is stopped when SPOC is standalone. |
Dispatcher Paragon Spooler Controller | Business logic layer for Terminal Server, FlexiSpooler, and Workflow Processing | Site Server | |
Dispatcher Paragon Mobile Print Server | Processes print jobs submitted via email workflows | Mobile Print Server | Multiple instances of MPS service can co-exist in one environment. |
Dispatcher Paragon Management Service | Hosting of Administrative web interface (Apache Tomcat), and management of the solution enterprise-wide | Management Server | |
Dispatcher Paragon LDAP Replicator | Responsible for replication of user data from directory services (Microsoft Active Directory) | Management Server | |
Dispatcher Paragon FlexiSpooler | Responsible for print job reception, storage, and release. | Site Server | |
Dispatcher Paragon Bundled Etcd | Responsible for centralized configuration of the solution | All |
Monitoring Network Services
In general, monitoring using TCP half-handshake / half-open connections is strongly recommended (similar monitoring technique is employed by load balancing solutions, like BIG-IP F5). Typical third party tool which is capable of performing half-open connections is nmap.
Port | Service | Description | Implications | Monitor on Management? | Monitor on Site Server? |
|---|---|---|---|---|---|
443 | Management Service service | Allows for the Dashboard | Stopping this service has impact on Dashboard availability | YES | NO |
515 | LPD listener | Allows for job reception from workstations | If unavailable, jobs are not being received by Site Server | NO | YES |
4096 | Management / Site Server service | Common port used for hardware terminal communication; also can be used to determine the service is up | If Management service is unavailable, Dashboard is unavailable as well (even if the service is running) | YES | YES |
5012 | Terminal Server service | Allows for Embedded Terminals authentication | If unavailable, users cannot authenticate at MFPs. | NO | YES |
9100 | SafeQ Client listener | Allows for job reception from SafeQ Client (only if failover option 4 or 5 is in use) | If unavailable, users cannot print | NO | YES |
Terminal Server API Integration
Dispatcher Paragon's Terminal Server, which is present on all Site Servers, has a REST API that can be leveraged to check availability of services. Infrastructure monitoring capable of leveraging this can access server status through the following cURL command, replacing {example.tld} with the Site Server's FQDN or IP address (default port is 5021):
For UNIX clients:
curl --include 'https://{example.tld}/ts/v1/hello'For Windows clients using PowerShell (curl is an alias for Invoke-WebRequest)
curl -Uri https://{example.tld}/ts/v1/helloIf the server is operational, a HTTP Response of 200 OK will be returned, HTTP Response 500 (Internal Server Error) indicates application failure.
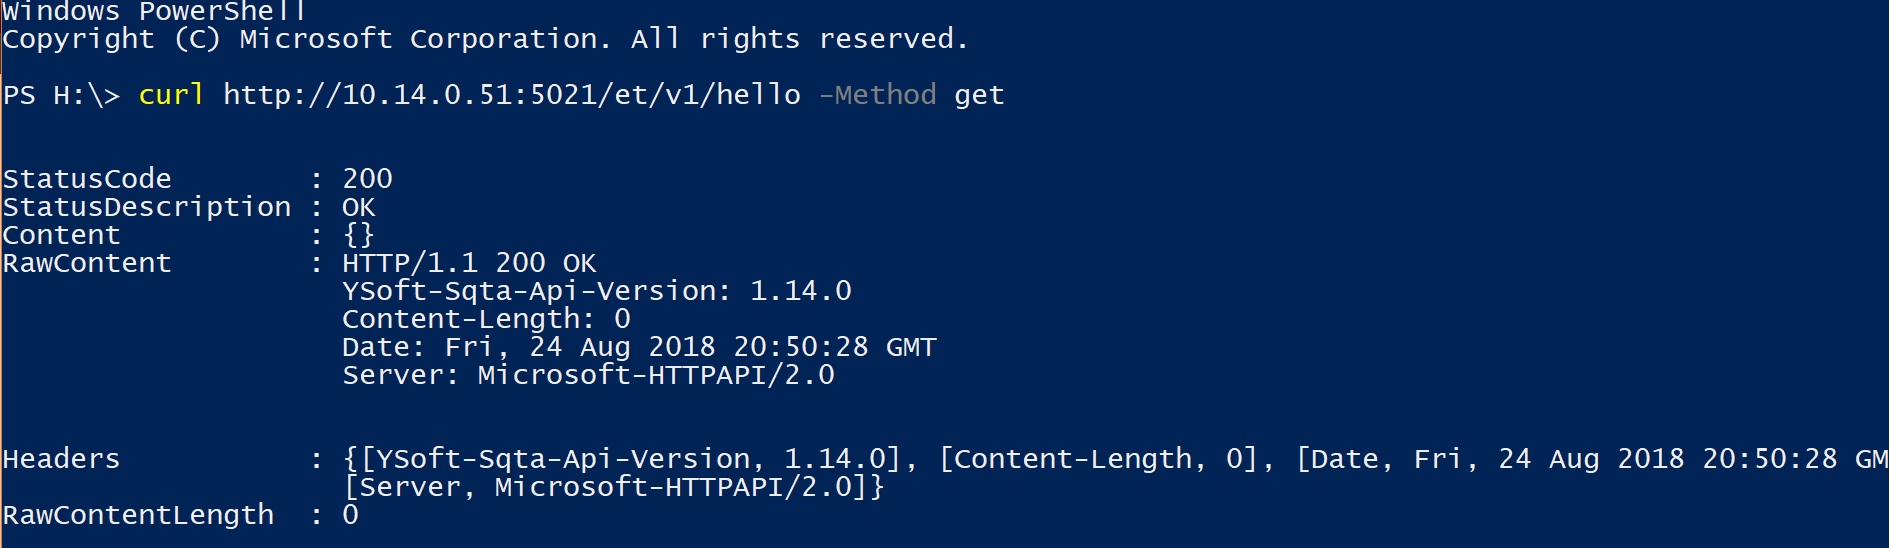
The HELLO resource is a diagnostics resource intentionally built into the Terminal Server service. Many application monitoring tools provide install-able agents or connectors which are able to invoke REST-ful Web Services and evaluate Status Code. While the resource can be checked manually, it's main purpose is to be monitored automatically by application monitoring solution.
Site Server Monitoring with JMX
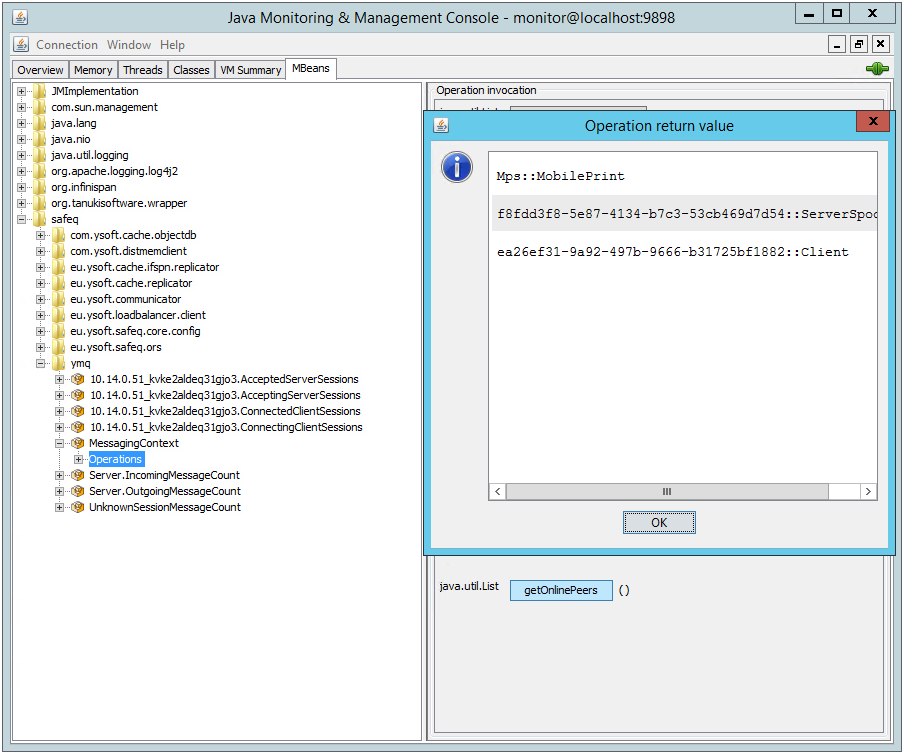
The Site Services installation can also be monitored through Java Management EXtensions (JMX) Management Beans (MBeans) exposed by the Dispatcher Paragon Spooler Controller service. JMX (Java Management Extensions) provide instrumentation of the Java Virtual Machine. Many application monitoring tools leverage JMX connectors which enable automated collection and monitoring of JMX metrics. JMX metrics can also be checked interactively using the bundled JConsole tool (see screenshot) or 3rd party JMX command line utility (https://github.com/jiaqi/jmxterm).
By default, JMX information is exposed on localhost interface on tcp/9898. Configuration can be changed to enforce TLS-based encryption and authentication by user / password.
Recommended JMX Mbeans and Metrics (Attributes) to include in Application Monitoring
MBean | Attribute | Description | Expected value |
|---|---|---|---|
distCache:component=CacheManager,name="cacheManager",type=CacheManager | clusterSize | Number of members of Site Server cluster. | The value should be equal on all members of the cluster. |
java.lang:type=Threading | threadCount | Number of threads | |
safeq/ymq/MessagingContext | getOnlinePeersCount | Number of connected peers | |
getOnlinePeers | List of connected peers | Matching GUIDs for Spoolers, Clients, and Mobile Print servers | |
getDisconnectedPeersCount | Number of disconnected peers | 0 | |
getDisconnectedPeers | List of disconnected peers | Should be empty | |
safeq/eu.ysoft.safeq.ors.OrsNode | getNodeState | The state of the Site Server | ONLINE |
Proactive Care
Konica Minolta offers a Dispatcher Paragon analysis solution known as Proactive Care, which was developed in response to monitoring requests by other customers.
The following files shall be monitored as often as every 15 minutes (shortTask configuration property in proactive-care-agent.conf). The files mentioned below are typically located in folder C:\DispatcherParagon\Proactive Care Agent\results, Those are CSV formatted files, columns are numbered starting at 1:
sqhc-orsmonitor-[cluster name].result
- Check column 1 for timestamp - alert if the file was not updated recently. Then the monitoring is not running.
- Check column 3 - alert if value is not 1. Then the server is offline.
- Check column 16 - alert if value is other than number of members in the cluster.
sqhc-services-[server name]-SPOC.result
- Check column 1 for timestamp - alert if the file was not updated recently. Then the monitoring is not running.
- Check columns 3-7 which record return value of the services. Alert if value is above expected threshold.
- XSA = ping result on https://" + hostName + ":5012/XeroxXSA/Service.asmx
- XSA_IP = ping result on https://" + hostIP + ":5012/XeroxXSA/Service.asmx"
- EIP = ping result on http://" + hostName + ":5011/
- EIP_IP = ping result on http://" + hostIP + ":5011/
- EUI = response from End User Interface
sqhc-services-[server name]-FSP.result
- Check column 1 for timestamp - alert if the file was not updated recently. Then the monitoring is not running.
- Check column 3 for LPR response - alert of not 0.
Infinispan HTTP/REST Endpoint
If advanced cluster health monitoring is required, including FlexiSpooler to Spooler Controller connectivity, locally available Infinispan HTTP/REST endpoint can be used. This endpoint is critical for system functionality and thus caution is advised.
- FlexiSpooler Address Book registrations can be retrieved from endpoint:
http://localhost:81/distLayer/com.ysoft.safeq.spoc.addressbook.AddressBook_distnamespace/
Please note that due to security/performance sensitivity, this endpoint is available on localhost / loopback network interface only.
Database Maintenance on Management Servers
Dispatcher Paragon performs internal database maintenance tasks regularly every day (by default configured for 1:00 / 1am).
Execution and successful finish of these maintenance tasks can be observed in the management-service logs:
Started service: 'DATABASE_MAINTENANCE' with result 'SUCCESS' for tenant: 'ApplicationTenantIdentification[tenantGuid=cluster_mngmt]'on cluster node: 'skyfwzbh4t0i1k9l'Upon successful finish, the following message is logged:
Ending invocation: 'Invocation[id=15266, invocationStatus=IN_PROGRESS, clusterNodeId='skyfwzbh4t0i1k9l',lastModification='2018-08-27T05:00:00.083Z', serviceIdentification=DATABASE_MAINTENANCE]'for tenant: 'ApplicationTenantIdentification[tenantGuid=cluster_mngmt]'Please note that the DATABASE_MAINTENANCE service task is triggered on all management servers. If you are working with single database instance for all cluster nodes, the task will successfully complete on only one of them.
Failure is indicated by the following message in the logs:
Started service: 'DATABASE_MAINTENANCE' with result 'FAILED' for tenant: 'ApplicationTenantIdentification[tenantGuid=cluster_mngmt]' on cluster node: '8612h4ol3voj5xpb'Please note that these messages are logged with INFO
severity, so you need to have INFO
log level enabled to see them.
Microsoft SQL Server: Logical Index Fragmentation
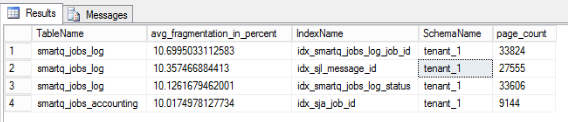
In case the regular maintenance fails to run, database indexes fragmentation will continue to increase over time (depending on the real traffic in the system). The expected fragmentation level is around 10%, should stay around this number and not increase over time. Expected runtime of the DATABASE_MAINTENANCE task is up to 15 minutes, depending on your configuration and fragmentation levels.
Fragmentation can be checked using the following query:
SELECTOBJECT_NAME(ips.object_id) AS [TableName],avg_fragmentation_in_percent,si.name [IndexName],schema_name(st.schema_id) AS [SchemaName], page_countFROM sys.dm_db_index_physical_stats(DB_ID(),NULL,NULL,NULL,'SAMPLED') ipsJOIN sys.tables st WITH ( NOLOCK )ON ips.object_id = st.object_idJOIN sys.indexes si WITH ( NOLOCK )ON ips.object_id = si.object_id AND ips.index_id = si.index_idWHERE st.is_ms_shipped = 0 AND si.name IS NOT NULLAND avg_fragmentation_in_percent>= 10 and page_count > 1000ORDER BY ips.avg_fragmentation_in_percent DESC;The sample output from that query can look like this:
More detailed information (for troubleshooting) can be obtained using the following query (which is more resource consuming and should only be used in case more detailed information is needed):
SELECTOBJECT_NAME(ips.object_id) AS [TableName],avg_fragmentation_in_percent,si.name [IndexName],schema_name(st.schema_id) AS [SchemaName],page_count,index_levelFROM sys.dm_db_index_physical_stats(DB_ID(),NULL,NULL,NULL,'detailed') ipsJOIN sys.tables st WITH ( NOLOCK )ON ips.object_id = st.object_idJOIN sys.indexes si WITH ( NOLOCK )ON ips.object_id = si.object_id AND ips.index_id = si.index_idWHERE st.is_ms_shipped = 0 AND si.name IS NOT NULLORDER BY si.name, index_level DESC