For monitoring database cluster, various 3rd party monitoring tools exists that are leverage PostgreSQL logging, events and specific queries. However, this section will not cover any external tool, but will rather give a slight overview upon PostgreSQL built in monitoring mechanisms,
Database logs
By default, database logs are located in data folder (e.g. PGSQL-data/pg_log) and is rolled over based on both log file size and file age. Log configuration could be changed in postgres.conf file. Log files should be checked whenever the recovery and/or fail-over is taking place, as well as when the database had started, to verify the process is behaving as expected.
In the context of Streaming Replications used for synchronizing databases between primary and standby databases, when starting the standby database , the following message should appear in the database log:
LOG: entering standby modeLOG: redo starts at 0/10000028LOG: consistent recovery state reached at 0/10000130LOG: database system is ready to accept read only connectionsLOG: started streaming WAL from primary at 0/11000000 on timeline 3It signifies, that all the changes from the primary database has been successfully applied, and the database is started in hot-standby mode, accepting read only connections.
When the primary database fails and the automatic fail-over is setup, the following logs will be recorder on the standby database:
LOG: replication terminated by primary serverDETAIL: End of WAL reached on timeline 3 at 0/1100B158.FATAL: could not send end-of-streaming message to primary: no COPY in progressLOG: invalid record length at 0/1100B158: wanted 24, got 0FATAL: could not connect to the primary server: could not connect to server: Connection refused (0x0000274D/10061)Is the server running on host "10.0.124.177" and acceptingTCP/IP connections on port 5432?...... after some time when the automatic fail-over promotes this standby database server to be a new primary database ......LOG: received promote requestLOG: redo done at 0/1100B0E8LOG: last completed transaction was at log time 2019-09-10 12:36:18.353551+02LOG: selected new timeline ID: 4LOG: archive recovery completeLOG: database system is ready to accept connectionsMore about database logging could be seen in official PostreSQL documentation here https://www.postgresql.org/docs/current/runtime-config-logging.html
Monitor database role
To check, which database is currently the primary database, execute the following query
select pg_is_in_recovery();If the result is true, queried database is standby; if false, it is primary.
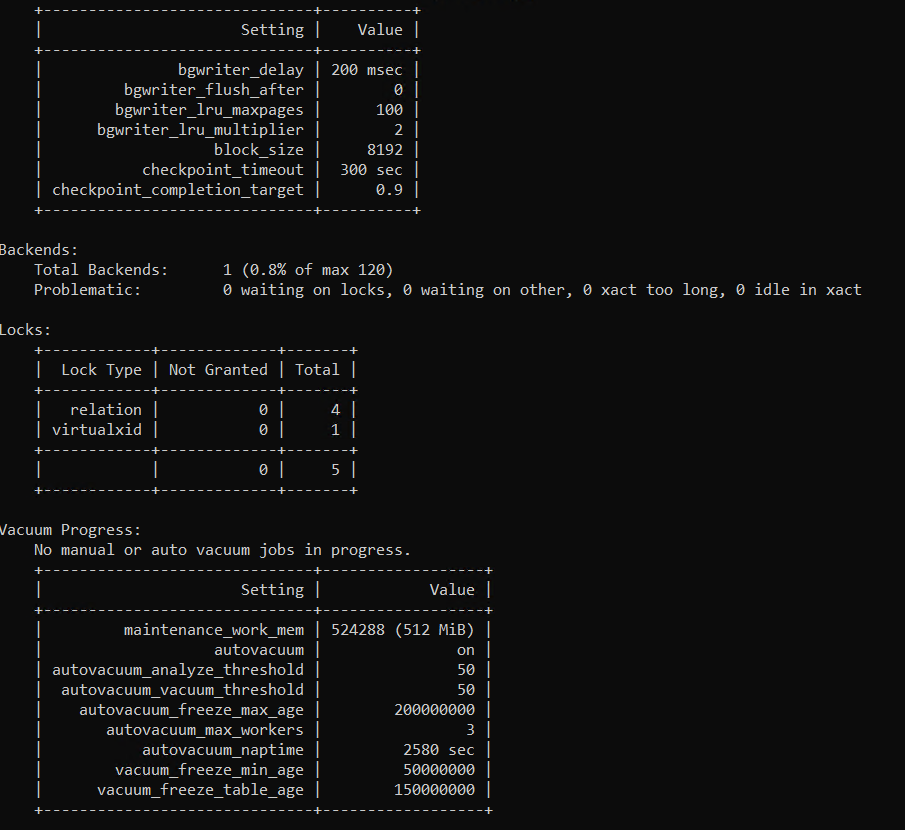
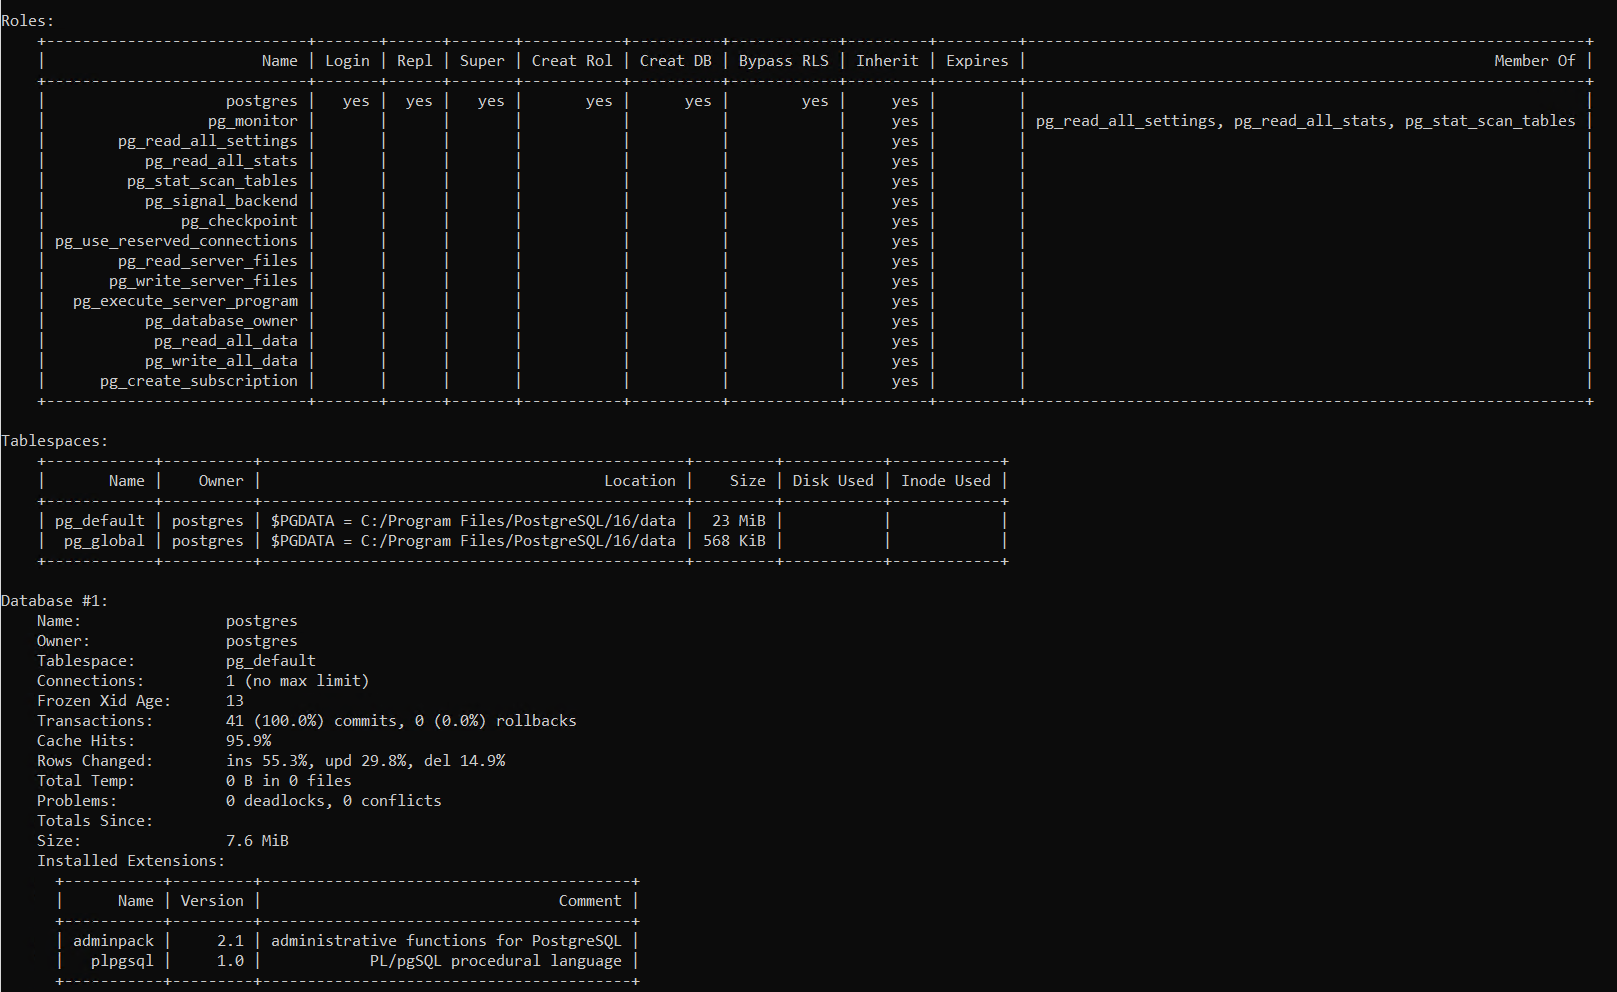
Optionally, pgmetrics tool could be used to list a handy overview of database current status also with various details not only about replication.
pgmetrics.exe -h <IP_address> -U <user_name>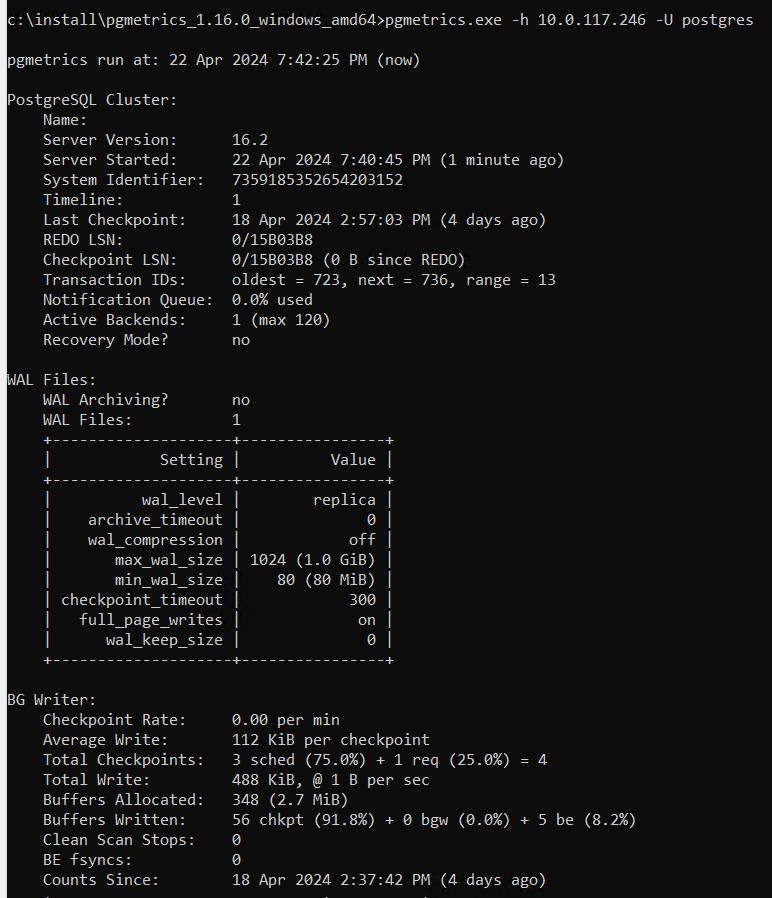
Queries for primary database
To get list of all standby servers as well as their current replication performance, run the following query:
selectpid,client_addr,application_name,usename,state,sync_state,pg_wal_lsn_diff(pg_current_wal_lsn(), sent_lsn) sending_lag,pg_wal_lsn_diff(sent_lsn, flush_lsn) receiving_lag,pg_wal_lsn_diff(flush_lsn, replay_lsn) replaying_lag,pg_wal_lsn_diff(pg_current_wal_lsn(), replay_lsn) total_lagfrom pg_stat_replication;- sending_lag could indicate heavy load on primary
- receiving_lag could indicate network issues or replica under heavy load
- replaying_lag could indicate replica under heavy load
To find out which file is currently used for write ahead log, execute this query:
select pg_walfile_name(pg_current_wal_lsn());Queries for standby database
To check delay on the standby, execute the following query:
SELECTCASEWHEN pg_last_wal_receive_lsn() = pg_last_wal_replay_lsn()THEN 0ELSE EXTRACT (EPOCH FROM now() - pg_last_xact_replay_timestamp())END AS log_delay;The result is the number of seconds between the transaction was aborted or committed on primary and the time it was received on the standby. If the replication did not started or failed to start, this query will return NULL.
Please note, that if the system time of these servers differs, the resulted number may be misleading.
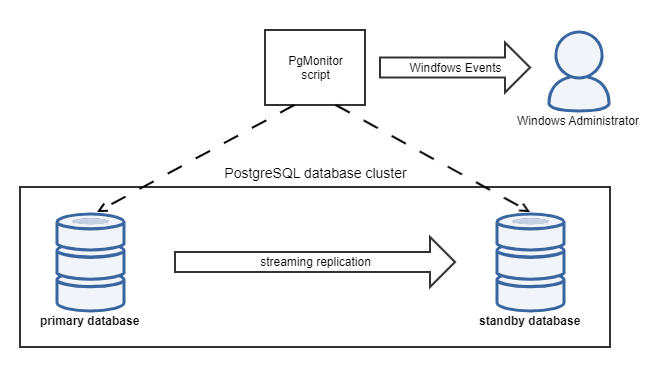
Automated monitoring
Automated monitoring is based on checking all the databases from any server on the network (will refer to this server as Monitoring server) in the predefined intervals and automatically log Windows Log Events in the following cases:
- primary server is inactive
- any standby server is inactive
- more than one primary server is active
This is achieved by Windows Scheduler invoking Powershell script which is using the same monitoring tools as described in this section above - executing SQL queries. Script could be scheduled on any server in the network, if the following preconditions have to be met:
- server has a network visibility to monitored databases, with allowed connection to the database ports
- PostrgreSQL CLI utilities has to be in PATH system environment variable (Dispatcher Paragon with embedded PostreSQL has CLI tools at '<PATH_TO_STANDBY_DATABASE_ROOT_FOLDER>\bin' folder. Default installation path of PostgreSQL CLI utilities is C:\Program Files\PostgreSQL\16\bin ).
Script location
Script are located in the full installation package <installation package>\Complementary Solutions/PostgreSQL/pg-failover.zip
For executing the script, a new database user with limited privileges has to exists. Its possible to reuse existed user, but its recommended to create a specific one for monitoring purposes only. On the primary database, create new user "cluster_monitor" (user will be replicated to the standby database automatically).
CREATEUSERcluster_monitor ENCRYPTEDPASSWORD'<CLUSTER_MONITOR_USER_PASSWORD>';Add the IP address of the Monitoring server to the
pg_hba.conffile on both primary and standby database.host postgres cluster_monitor <IP_ADDRESS_OF_THE_MONITOR_SERVER>/32md5n the monitoring server add an entry to the
pgpass.conffile for each database server. Default location ofpgpass.confis in%APPDATA%\postgresql\pgpass.conf(where%APPDATA%refers to the Application Data subdirectory in the user's profile). This is standard PostgreSQL security feature - for more details refer to the official documentation: https://www.postgresql.org/docs/current/libpq-pgpass.html<PRIMARY_DATABASE_IP_ADDRESS>:<DATABASE_PORT>:postgres:cluster_monitor:<CLUSTER_MONITOR_USER_PASSWORD><STANDBY_DATABASE_IP_ADDRESS>:<DATABASE_PORT>:postgres:cluster_monitor:<CLUSTER_MONITOR_USER_PASSWORD>PATH Variable
Please note, for the script to work properly the System Environment Variable must be set properly. The script needs to access pg_isready.exe and psql.exe, so those files must be on the monitoring server and the proper path must be set in PATH system environment variables. Sometimes a restart of the Windows machine is required in order to force through the changes.
- Copy the PowerShell script PgMonitor.ps1 to the Monitoring server
- On the Monitoring server
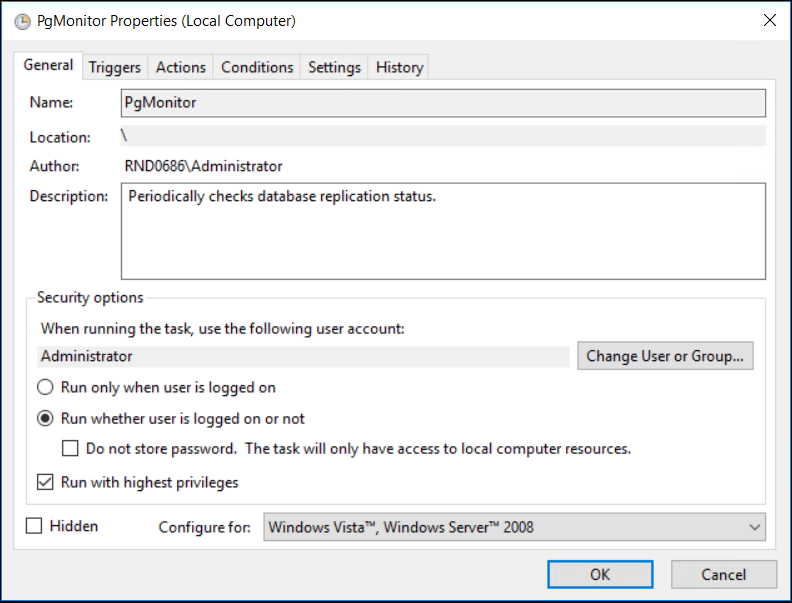
- create a new scheduled task in the Task Scheduler
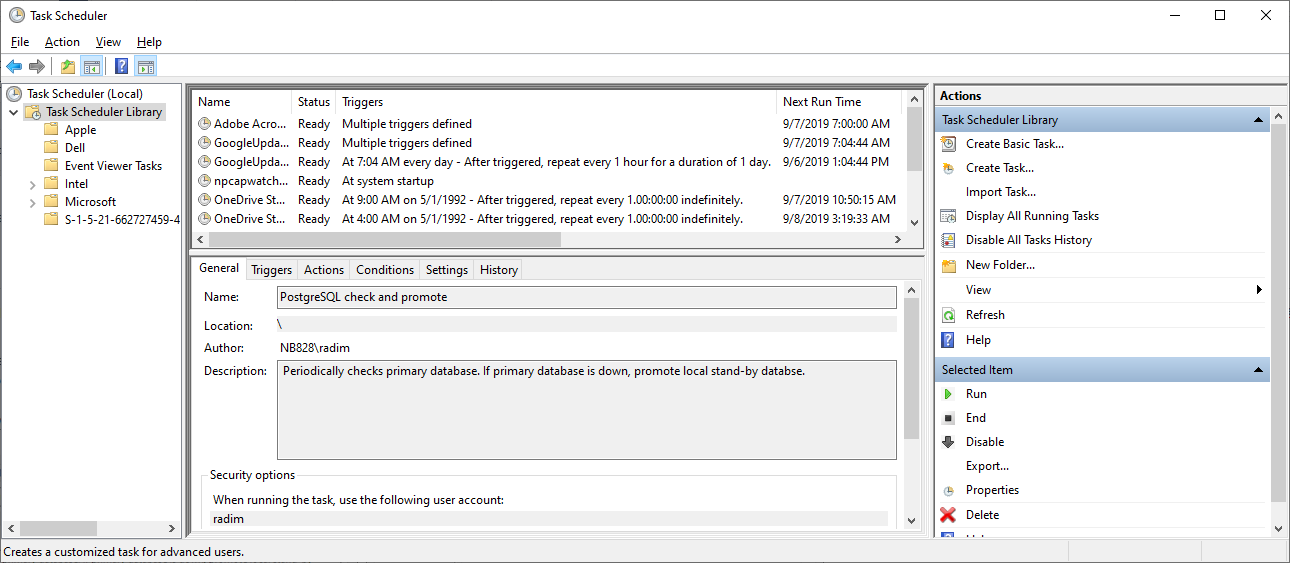
- In "General" tab, fill the name, description, check "Run whether user is logged on or not" and "Run with highest privileges".
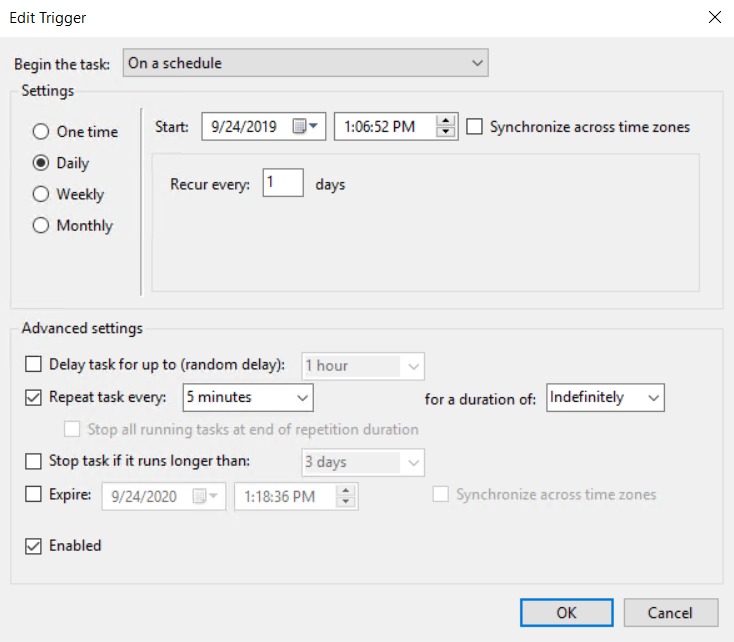
- In "Triggers" tab, create new trigger, that will run every 5 minutes and never expires.
In the "Actions" tab, create a new action that will start a script. Use Powershell as program to start and add following arguments. At least 2 IP addresses are required.
-File"<path_to_script>\PgMonitor.ps1"<PRIMARY_DATABASE_IP_ADDRESS>:<DATABASE_PORT>,STANDBY_DATABASE_IP_ADDRESS:<DATABASE_PORT> cluster_monitor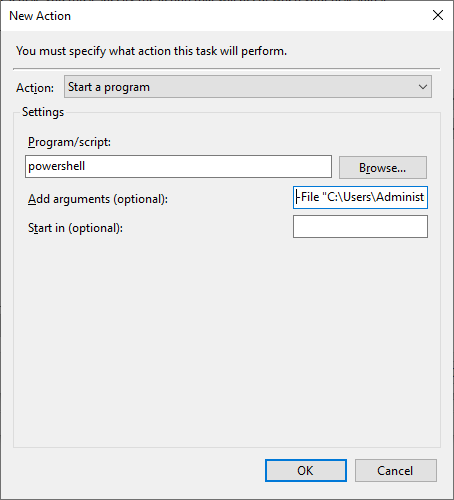
- create a new scheduled task in the Task Scheduler
- Save the scheduled task and trigger it manually to ensure it will run in predefined interval. Wait till the task runs at least once and check Windows Event Application log for errors. In the case of properly configured task, no event is listed there.
(Optional) if you are not sure if the script is invoked correctly, you can turn on logging by add log parameter to turn logging on. Example: -log "C:\logs\PgMonitor.log"
-File"<path_to_script>\PgMonitor.ps1"<PRIMARY_DATABASE_IP_ADDRESS>:<DATABASE_PORT>,STANDBY_DATABASE_IP_ADDRESS:<DATABASE_PORT> cluster_monitor"C:\logs\PgMonitor.log"
When automatic monitoring script detects the failure, it logs a Warning Windows event in Event Log.

The following events are logged to the Windows Event Log.
EventID | Title | Description | Level | Source |
|---|---|---|---|---|
1 | Environment check failed | Some of the PostgreSQL CLI utilities were not found on PATH or the invalid arguments have been provided. See the error message which tells you what happen. | Error | PostgreSQLMonitorScript |
2 | Any of the standby database is not responding | Number of active standby databases differs from the number of all provided databases minus one primary database. | Warning | PostgreSQLMonitorScript |
3 | Primary database is not responding | The primary database is not responding. | Warning | PostgreSQLMonitorScript |
4 | More than one primary database has been detected | More than one active primary database exists. | Warning | PostgreSQLMonitorScript |
Windows Event
Please note, that the PgMonitor.ps1 script creates only a Windows Event. Its up to each administrator to setup a subsequent notification. Also there is no internal memory/history of the previous runs. This means the scheduler will execute the PgMonitor.ps1 script every time (according to configured interval), and in case the error, the Windows Event Log is created until the detected issue is fixed or the scheduled task is disabled/removed.
It is recommend to add a custom action on the event ID 2, 3 and 4 (for example to send an email to the administrators).