Overview
This page describes the Web reports page, which is a central interface for accessing and managing Usage and Costs reports and Green reports.
Web reports consist of two kinds of statistical data: basic statistics and detailed statistics. Detailed statistics contain details about each individual job accounted by Dispatcher Paragon. Basic statistics are created from detailed statistics by grouping similar jobs by one-hour intervals. Basic statistics preserve key dimensions (print/copy/scan, username, cost center, device, and billing codes) but drop job-specific ones (job title, job origin, exact time).
Legislation in some countries (e.g., Germany) requires that no one, not even an administrator, is able to see personal details (including job name) in various systems.
To achieve the desired behavior, set the following system configuration options per tenant to these values:
- showJobTitle: Disabled
- show-job-user: Disabled
The report Per user and any report that contains the columns User - ID, User - login, User - name, and Job title will not be available. Additionally, the Limit to users section of the Advanced filter (both in Standard and Weekly averages reports) will not be available.
See Job list documentation for additional information about anonymous data in other parts of the system.
Displaying the Web Reports Page
To display the Web reports page:
- Log into the Dispatcher Paragon management interface with sufficient rights to administrate printers (e.g. as an "admin")
- Go to Reports > Web reports
Selecting a Report to View
On the Web reports page, use the filters to select the desired report to view.
- Type of report – Standard or weekly averages. Standard reports display summary data grouped by selected columns while Weekly averages display averages for each hour of the day in the selected period
- Report – Standard, per device, per device cost center, per device group, etc.
- Report period – Start and end date of the report
Selecting Specific Information to Include in the Report
Click Show advanced filter (located on the right-hand side of the filter panel).
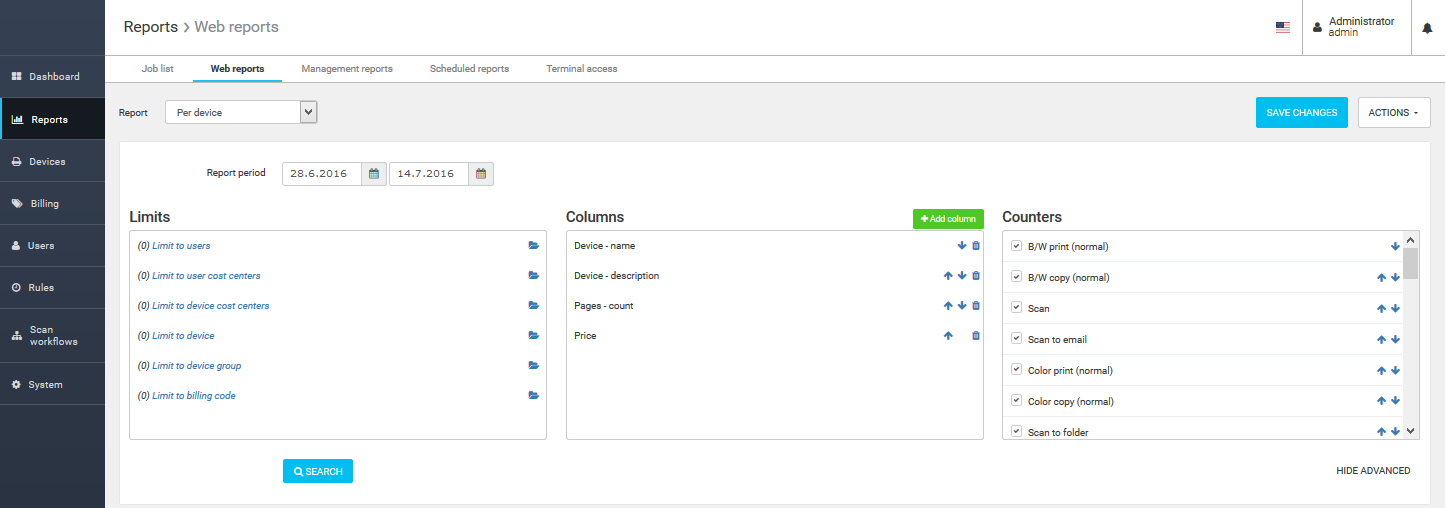
The Advanced filters provide many options to limit the information to be included in the selected report:
Limits (filters)
- Limit to users – Include only data for the selected users
- Limit to user cost centers – Include only data for the selected users' cost centers
- Limit to device cost centers – Include only data for the selected devices' cost centers
- Limit to device – Include only data for the selected devices
- Limit to device group – Include only data for the selected group of devices
- Limit to billing code – Include only data for the selected billing codes
The maximum number of entities that can be used in the filter of each type (users, devices, etc.) is 50. This value can be set in the global system settings option called smartQ-max-items.
Columns
To specify which columns will be visible in the generated report, click the green Add column button and then choose the column name from the list to add it into the Columns included in report section.
Green reports enable four columns with the prefix Costs that show the printing impact on the environment:
- Costs – CO2 [kg]
- Costs – energy [kWh]
- Costs – trees
- Costs – water [l]
A more detailed guide for configuring and using Green reports is described in the article "Green reporting - Purged Pages".
ABS [mm] and PLA [mm] counters relate to 3D printing. They are used to report how much of the aforementioned material was used during the reporting period. The value of these counters is reported in millimeters of used material length.
File - type and File type name are only supported for print jobs, not for copies or scans.
Please note that Average coverage information is available only for jobs accounted for using Coverage accounting.
Counters
Use the checkboxes next to the accounting counters to include counters in the report or to exclude them from the report.
The report will also include a counters overview. To change the order of counters in this overview, use the associated arrow icons.
Purge print counters show the number of pages that were sent to Dispatcher Paragon but were not printed (deleted at the terminal, on the Dispatcher Paragon management interface, or automatically by the system).
Counters in italics are summary counters that display the sum of several other counters. For example, the B/W pages counter represents the sum of all counters for specific types of black and white pages (print, copy, both page sizes).
Displaying and Working with a Report
After a predefined report or a customized report using filter options is selected, Search to display the report.
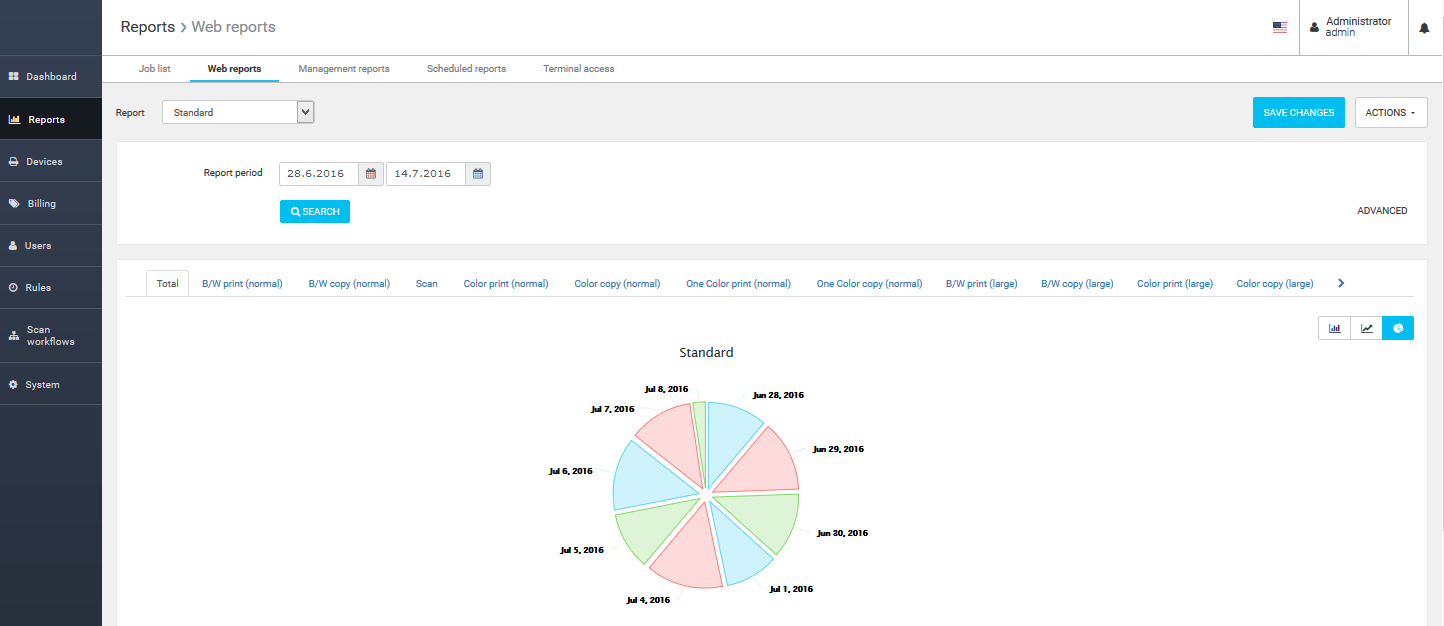
At the top of the report, counter types: Total, B/W print, B/W copy, Color pages, and so on are shown. To display only selected counter types, click the desired counter types. For example, to display only B/W prints, click B/W print.
The reports will display:
- A bar, line or pie graph (if hidden, click the graph icon in the top left-hand corner of the report)
- A general report for the selected time interval
- A report according to advanced filter settings (depending on the length, the report can be broken down into multiple pages – use pager arrows in the bottom right-hand corner of the page to move between pages)
Action Options
To display Action options, click the Actions button. The following options appear:
- Include latest processed data – The report will be calculated to include the latest processed data (data that has been saved in the database for more than one hour but has not been added to the report by the hourly executed statistics generator task). Include latest processed data works correctly only with a correctly configured PostgreSQL timezone
- Recalculate statistics – The report will be recalculated to include the latest processed data (last month data in reports will be deleted and will be included in reports again)
- Delete current custom filter – Delete the current customized filter (if you have selected filter options)
- Export report to... – Selecting one of the four options exports the displayed report to a file with a selected extension. Choose between Microsoft Excel (CSV or XLSX), PDF, HTML or an XML file.
Exporting web reports may be limited if the number of report rows to be exported exceeds the expert configuration property Export report maximum row count threshold value. By default, this feature is disabled.
Saving the Changes You Made as a New Customized Report
To save all the changes made on the Web reports page (visible columns, the order of columns, and other changes), click Save changes, then enter a name for the new customized report. Dispatcher Paragon saves the report and it will be available directly from the Report filter drop-down menu the next time it is needed.
When you save a customized report, it is saved only for the current user. This means that the customized report will be visible exclusively to the user who created it.