Analytics
Dispatcher Phoenix Web provides access to an easy-to-read, real-time Dashboard of analytics regarding your servers and processes.
To enable auditing, you must first check the Enable workflow auditing box from the Database Setup tab of the Options window in the Dispatcher Phoenix client application. (To access the Options window, select Tools > Options).
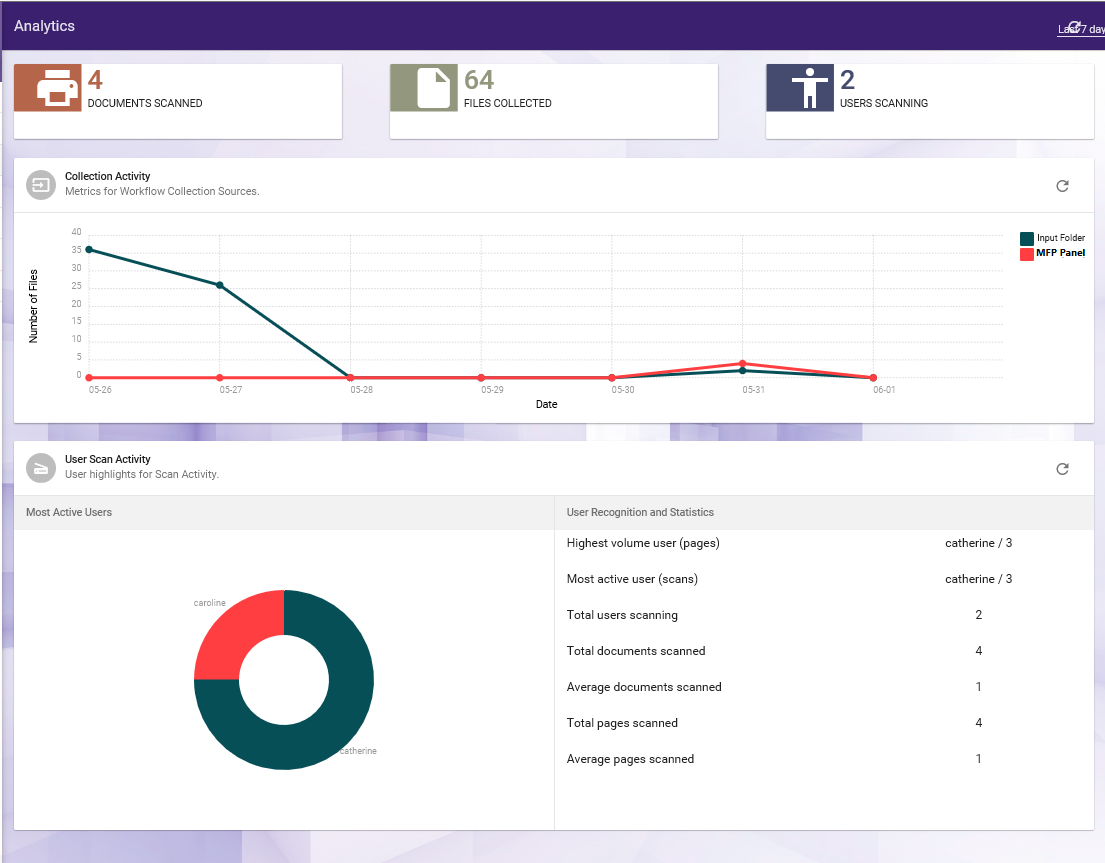
From Dispatcher Phoenix Web, select the Analytics button or the Dashboard > Analytics option from the slide out menu. The following page will appear:

This page is populated with the following information:
- Total number of documents scanned (for all users).
- The number of files collected.
- The number of users scanning documents.
- The number of files collected, per input source.
- A visual break-down of scan activity, including:
- Highest volume user
- Most active user
- Total users scanning
- Total documents scanned
- Average documents scanned (per day)
- Total pages scanned
- Averages pages scanned (per day)
- User Scan Activity - Displays top 5 user activity details.
Customizing Your Dashboard View
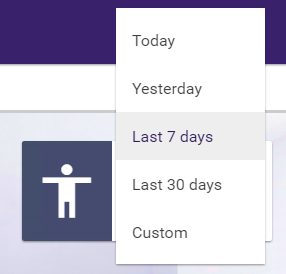
To adjust the date range, select the Last 7 days drop-down list on the upper right-hand side of the page. The following menu will appear:

You can choose to display statistics for:
- Last 7 days (default view)
- Today
- Yesterday
- Last 30 days
- Custom
Configuring Custom Date Range
If you select Custom to configure a custom time period for your reporting data, calendar icons will appear, as in the following illustration:

You can choose the date ranges using the pop up calendars; then select the APPLY button.

